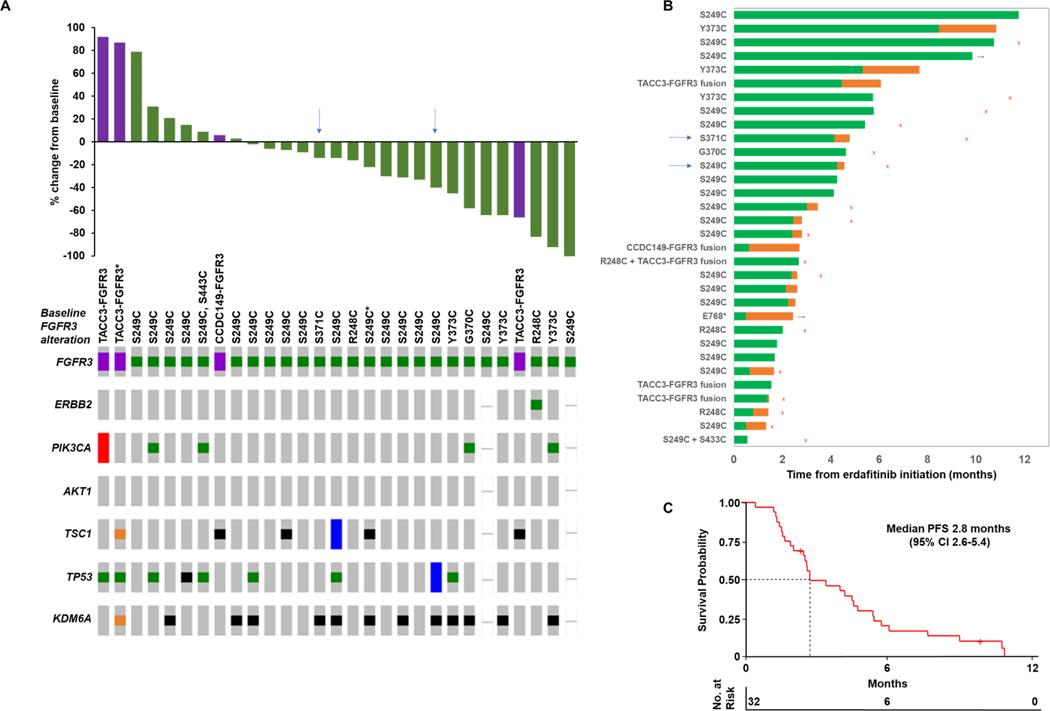
Figure 2. Real-world cohort of metastatic urothelial carcinoma patients treatment with erdafitinib.
(A) Waterfall plot depicting best overall response to erdafitinib therapy as well as pre-treatment FGFR3 alteration status and oncoprint depicting selected genomic co-alterations. (B) Swimmer’s plot displaying time on treatment with erdafitinib (Green bars). Orange bars indicate breaks between the last dose of erdafitinib and progression of disease or last follow-up—such breaks in erdafitinib were generally related to treatment-related toxicities. Black arrows denote patients who remain without progression of disease at last follow-up. Red “x”s denote patient deaths. Blue arrows denote patients who developed second site mutations of FGFR3 detected in cell-free DNA after initiating erdafitinib. (C) Kaplan-Meier analysis of progression-free survival of patients treated with erdafitinib therapy.
CI, confidence interval; PFS, progression-free survival
*FGFR3 alteration detected in pre-treatment cell-free DNA; all other baseline FGFR3 alterations displayed were detected by tumor sequencing.

