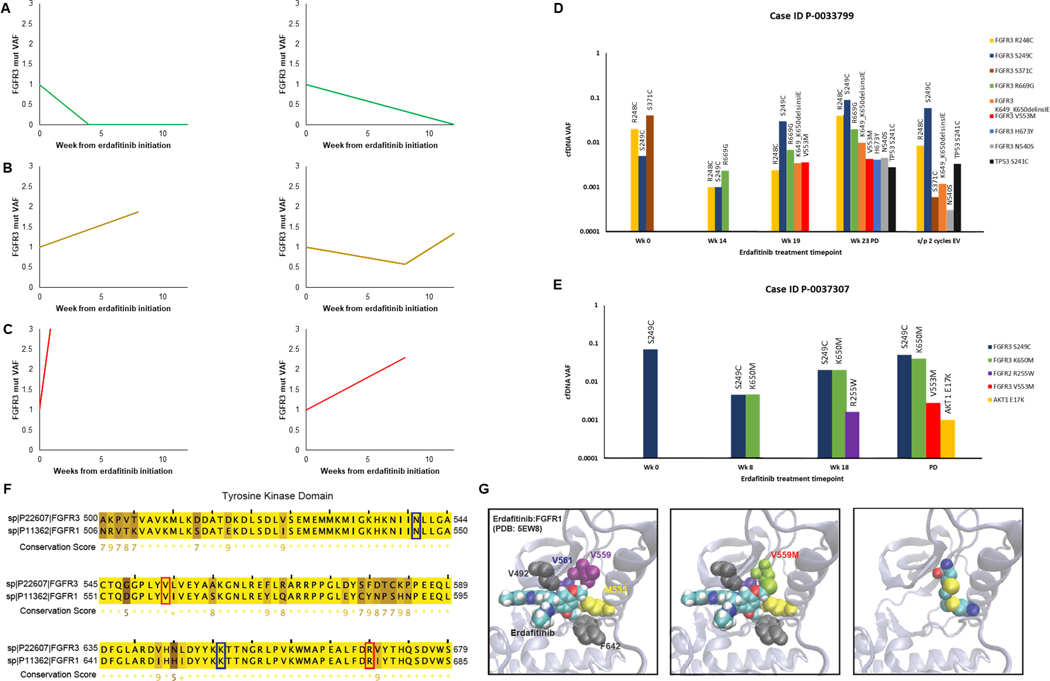
Figure 3. Cell-free DNA analysis of serial samples collected from metastatic urothelial cancer patients treated with erdafitinib.
(A-C) Changes in cfDNA FGFR3 VAF overtime on erdafitinib in patients who achieved a response (A), stable disease (B) or had primary disease progression (C). VAF was normalized to the pre-treatment cfDNA sample. (D-E) Bar graphs of cfDNA VAF for selected patients who acquired new alterations in FGFR3 signaling pathways or TP53. Plots include changes in the baseline cfDNA FGFR3 VAF as well as VAF of newly acquired alterations. (F) Paralogy analysis showing residues of the tyrosine kinase domain that are highly conserved between FGFR1 and FGFR3. Residues involved in FGFR3 alterations acquired on-treatment in the erdafitinib treated cohort are highlighted, with amino acid residues implicated in known drug resistant mutation highlighted in blue, and others highlighted in red. (G) In silico model of erdafitinib in binding pocket of FGFR1 based on previously reported crystal structure of FGFR1 (PDB:5EW8). Relevant amino acid residues that interact with erdafitinib are highlighted. FGFR1 V559M (paralogous to FGFR3 V553M, a novel cfDNA alteration acquired on erdafitinib in our cohort) could result in sulfur-sulfur bond formation that would sterically inhibit erdafitinib binding. cfDNA, cell-free DNA; EV, enfortumab vedotin; mut, mutation; PD, progression of disease; VAF, variant allele frequency; Wk, week

