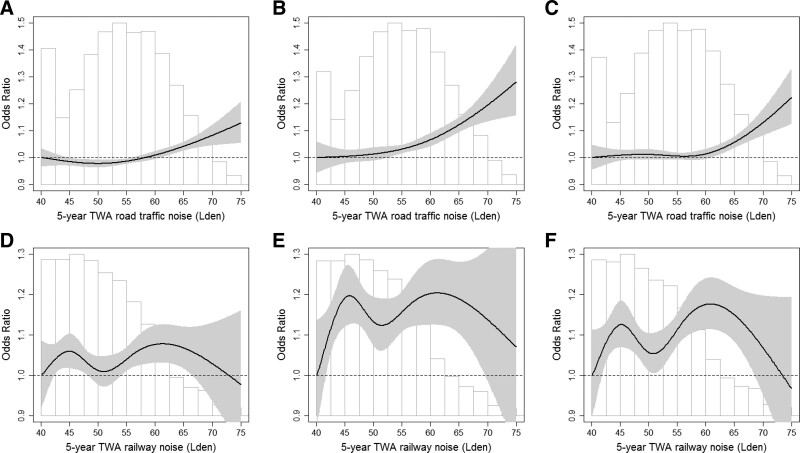
Figure 1.
Exposure-response associations (OR per 10 dB increment) between road traffic and railway noise, respectively, and overweight, obesity, and central obesity in pooled analyses of 11 Nordic cohorts. Road traffic noise (A–C): natural splines with knots at the 20th, 40th, 60th, and 80th percentile. A, Overweight: N = 162,639; n = 79,367 cases of overweight. Likelihood ratio test of linear vs spline: P value = 0.0387. In a separate analysis OR over 53 dB as an inflection point is OR 1.064 (95% CI = 1.031, 1.084) per 10 dB increase. B, Obesity: N = 102,823; n = 19,584 cases of obesity. Likelihood ratio test of linear vs spline: P value = 0.0188. In a separate analysis OR over 53 dB as an inflection point is 1.102 (95% CI = 1.055, 1.151) per 10 dB increase. C, Central obesity: N = 127,040; n = 31,608 cases of central obesity. Likelihood ratio test of linear vs spline: P value = 0. 0052. In a separate analysis OR over 58 dB as an inflection point is 1.086 (95% CI = 1.011, 1.166) per 10 dB increase. Railway noise (D–F): D, Overweight: natural splines with the forced placement of knots at 44.1, 48.1, 52.4, and 57.6 dB Lden (the 20th, 40th, 60th, and 80th percentile among those exposed to railway noise >40 dB). N = 36,747, n = 18,989 cases. E, Obesity: natural splines with the forced placement of knots at 44.2, 48.2, 52.5, 57.6 dB Lden (the 20th, 40th, 60th, and 80th percentile among exposed to railway noise >40 dB). N = 22,770, n = 5,012 cases. F, Central obesity: natural splines with the forced placement of knots at 44.1, 48.0, 52.4, 57.7 dB Lden (the 20th, 40th, 60th, and 80th percentile among exposed to railway noise >40 dB). N = 28,944, n = 7,475 cases. Adjusted for cohort, sex, age, recruitment year, educational level, marital status, area income, smoking status, and physical activity. Overweight: body mass index (BMI) ≥25 kg/m² compared with BMI <25 kg/m². Obesity: BMI ≥30 kg/m² compared with BMI <25 kg/m². Central obesity: women: ≥88 cm compared with <88 cm; men: ≥102 cm compared with <102 cm. TWA, time-weighted average.

