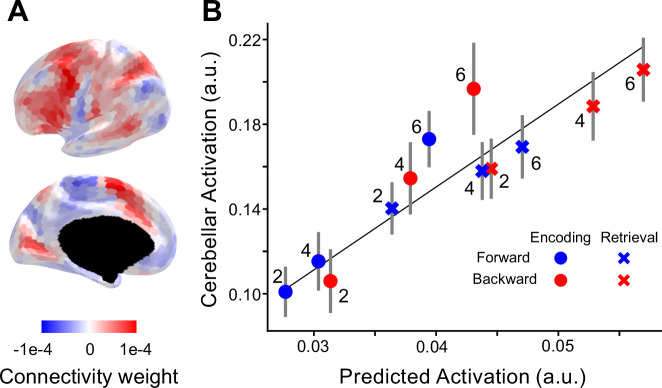
Figure 6. Selective recruitment of cerebellum in digit span task.
(A) Average connectivity weights from a group-level connectivity model for the cerebellar D3R region of interest. (B) Average observed cerebellar activation (y-axis) plotted against average prediction from the connectivity model (x-axis). Line shows the best linear relationship between predicted and observed activity with an intercept of zero. Error bars show standard error of the mean (SEM) of the signed residuals for each condition across subjects.

