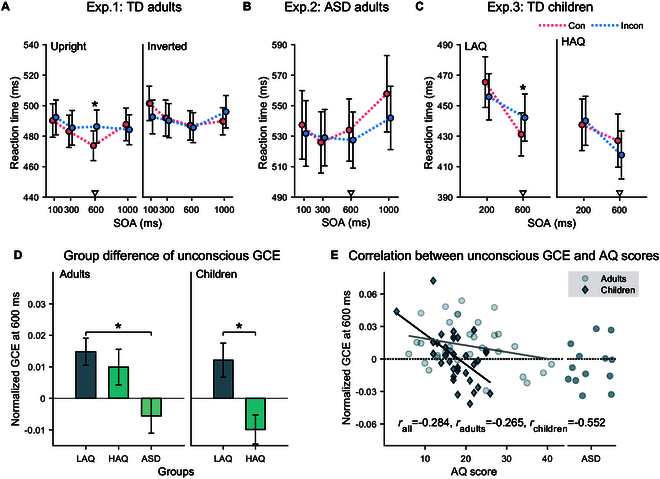
Fig. 2.

Unconscious GCE and its relationship with autistic traits and ASD. (A) When the schematic face was upright (left plane), the invisible gaze cues effectively induced a cueing effect at the 600-ms SOA level (~12 ms). However, this effect disappeared when the schematic face was presented upside-down (right plane). (B) The unconscious GCE did not emerge in autistic adults. (C) The children with low autistic traits (LAQ) exhibited a significant cueing effect at the SOA of 600 ms, while the children with high autistic traits (HAQ) did not show this effect. (D) The bars show the unconscious GCEs of different groups at the SOA of 600 ms in both adults and children. (E) The scatterplots demonstrate the correlations of the unconscious GCE at the SOA of 600 ms with AQ scores in TD children (represented by dark diamond) and TD adults (represented by light dots). The individual data for autistic adults are labeled on the right side of the scatter for reference. The children group showed a significantly moderate negative association, while the adults group exhibited a negative correlation trend. The triangle markers in the line graph indicate the levels of SOA used for between-group analysis of the GCEs. Error bars represent SEM. *P < 0.05, corrected for multiple comparisons.
