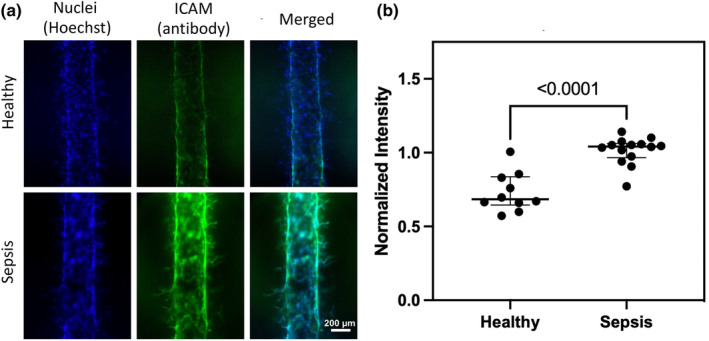
FIGURE 2.

(a) ICAM staining on representative sepsis and healthy lumens. (b) Intensity of ICAM staining after incubation with representative healthy (n = 10 technical replicates) and sepsis plasma (n = 15 technical replicates) indicating significantly increased ICAM expression on sepsis lumens (MFI 0.7, IQR 0.15 vs. 1.04, IQR 0.07, p < 0.0001.)
