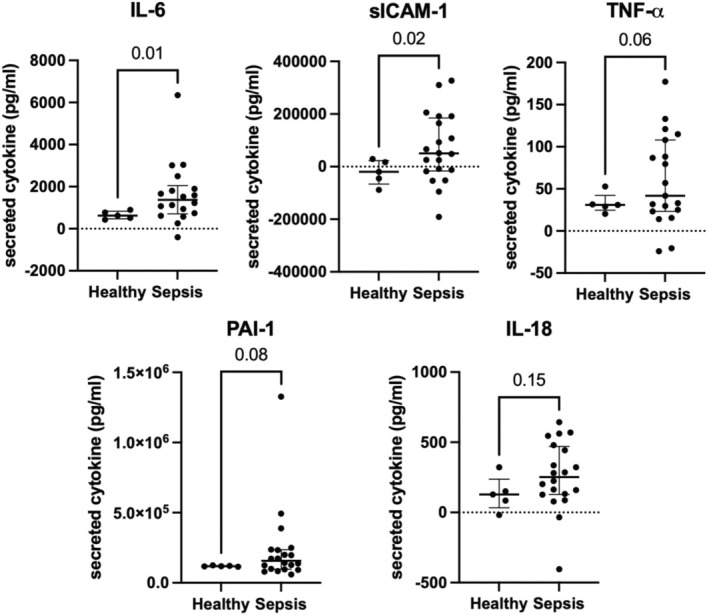
FIGURE 3.

Sepsis plasma (n = 20) induces greater endothelial cell (EC) cytokine and endothelial inflammatory marker secretion compared with healthy plasma (n = 5). Levels were calculated as value obtained from the plasma after 16‐h incubation in the endothelial MPS minus the value obtained from the plasma prior to incubation in MPS. (IL‐6 sepsis median 1370.8 pg/mL, IQR 1088.4 vs. healthy 621.8 pg/mL, IQR 258.1, p = 0.01; sICAM‐1 sepsis median 50238.7 pg/mL, IQR 185539.3 vs. −19934.6 pg/mL, IQR 61657.0, p = 0.02; TNF‐α sepsis median 49.4 pg/mL, IQR 85.0 vs. healthy median 30.9 pg/mL, IQR 2.5, p = 0.06; PAI‐1 sepsis median 156488.4 pg/mL, IQR 135080.3 vs. healthy median 118532.9 pg/mL, IQR 3651.6, p = 0.08) Negative values indicate a decline in cytokine concentration from baseline to post‐incubation. Table S1 summarizes cytokine concentrations.
