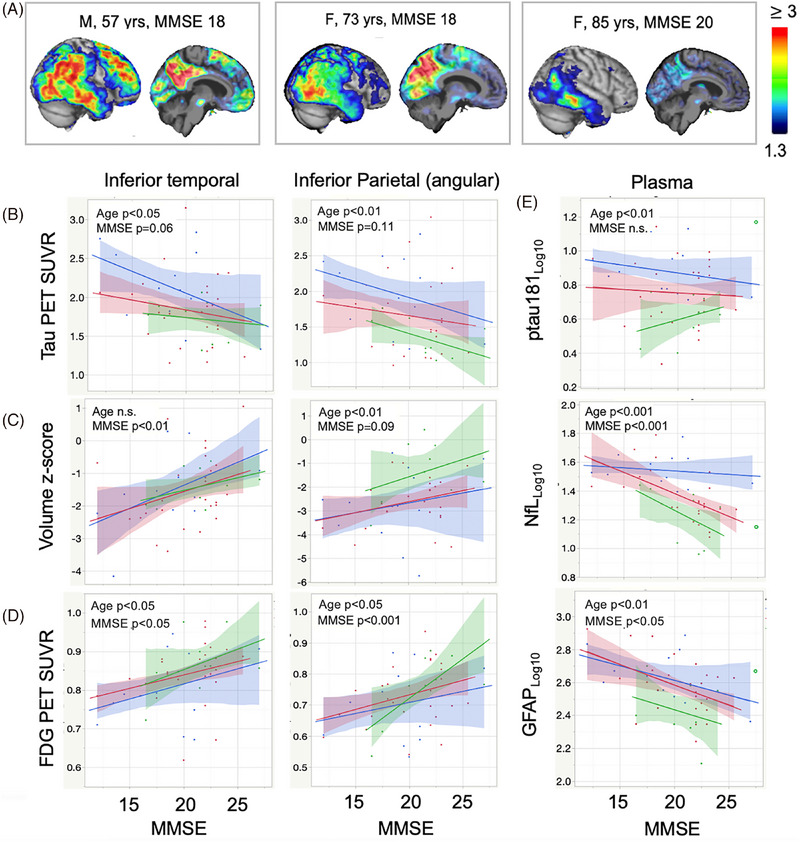
FIGURE 1.

Imaging and plasma biomarker distributions and relationships to MMSE and age. (A) Flortaucipir SUVR images for three subjects of varying age and tau spatial extent. (B‐D) Relationships between tau PET, volume, and FDG PET with MMSE score, stratified by age‐decade (57‐69, blue; 70‐79, red; 80‐90, green). (E) Relationships of pTau‐181, NfL, and GFAP to MMSE stratified by age‐decade (same color table). Overall correlations are apparent as well as an age effect within the biomarker‐clinical severity relationships despite adjustment for normal aging. The unfilled green circle is for one participant in the 80‐ to 90‐year group whose plasma values were outliers and are not included in the line of fit. “n.s.” = not significant (p‐values between 0.05 and 0.12 listed as a trend).
