
FIGURE 2.
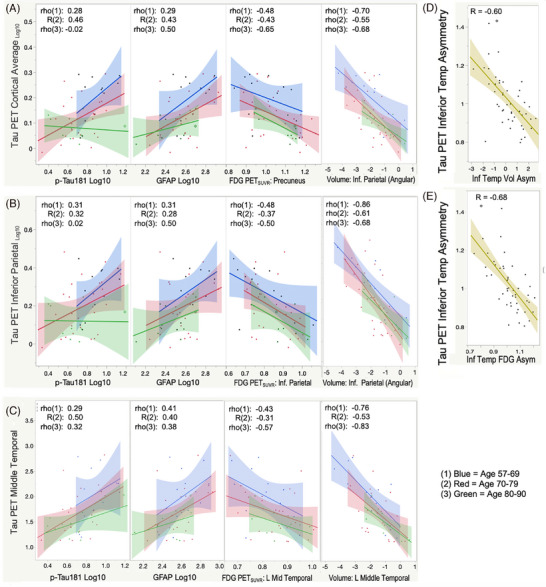
Relationships between tau PET and other imaging and plasma biomarkers. Relationship between tau PET in (A) total cortical, (B) inferior parietal, and (C) left inferior temporal regions as compared to pTau‐181log10, GFAPlog10, regional FDG SUVR, and regional volumes. Correlation coefficients are shown for the three age‐decade groups: (1) 57–69 years (blue), (2) 70–79 years (red), (3) 80–90 years (green). (D, E) The relationships between hemispheric asymmetry in the inferior iemporal region for tau PET as compared to volume and FDG PET, respectively.