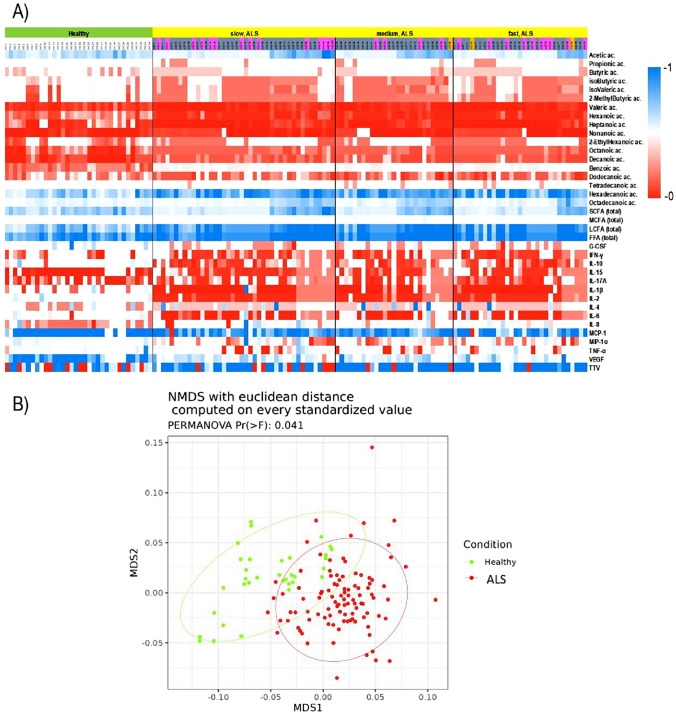
Fig. 2.
A Heatmap visualization based on cytokines, free fatty acids, and TTV distribution. Rows: biological variables; columns: patients. Green: HC; yellow: ALS patients; pink = bulbar onset; gray = spinal onset; orange = respiratory onset. Color key indicates metabolite expression value: blue: lowest; red: highest. B The sample distances among ALS patients and healthy controls have been represented through a NMDS plot with Euclidean distance on standardized values and the estimated 95% confidence interval of group centroids has been tracked as ellipses

