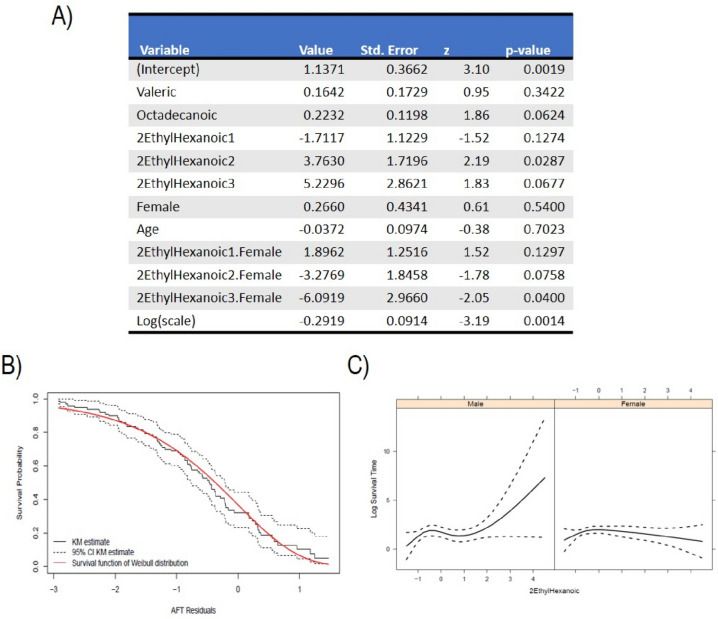
Fig. 4.
A Summary of the fitted survival regression model. The table reports estimated values for each predictor variable in the model, including the intercept and the log of the scale parameter. “Std. Error” is the standard deviation of the sampling distribution of the coefficient estimates, indicating the precision of the estimates. “z” is the z-statistic for each coefficient, used to test the significance of each parameter. “p-value” is the p-value associated with the z-value, indicating the significance of each predictor variable in the model; B The validity of the assumed Weibull distribution for the survival times can be assessed using residuals that account for censoring. This is done by computing the fitted model residuals and creating a Kaplan–Meier estimate. The estimated residuals and the assumed Weibull distribution are then plotted and compared to assess their fit. A good fit to the data indicates that the Weibull distribution is a suitable model for the survival times. The solid black line represents the Kaplan–Meier estimator of the residuals, with the black dotted lines representing the upper and lower 95%CI. The solid red line represents the survival probability estimated with the fitted AFT model. C Graphical representation of the effect of 2-ethylhexanoic acid on log survival time, considering its interaction with sex. The left panel shows the effect of 2-ethylhexanoic acid on log survival for male patients and the right panel for females. Since we modeled the effect of 2-ethylhexanoic using nonlinear terms (cubic splines), it is not constant for different expression levels. Since the biological features have been standardized, the value “0” for 2-ethylhexanoic denotes the average expression of 2-ethylhexanoic acid

