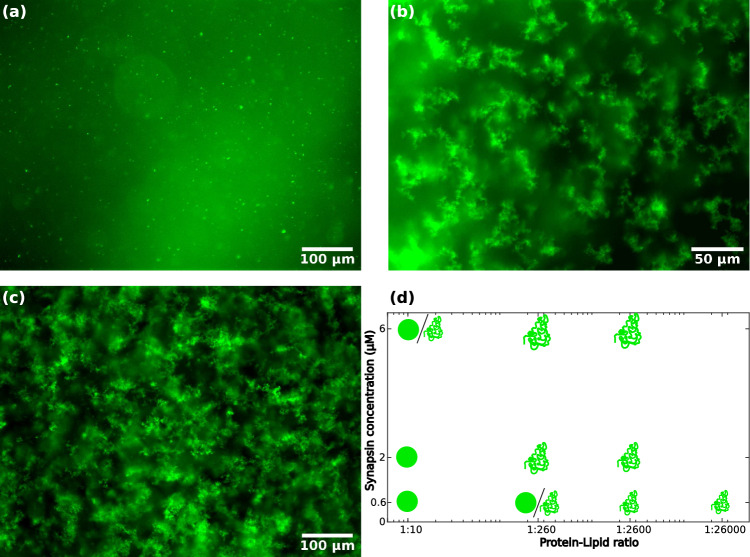
Fig. 2.
Fluorescence microscopy images of LV4-synapsin condensates for different protein-to-lipid ratios and a phase diagram for the condensate formation. a Fluorescence microscopy image of condensates consisting of synapsin and LV4 () with a magnification of 20. b Fluorescence microscopy image of condensates consisting of synapsin and LV4 () with a magnification of 40. c Fluorescence microscopy image of condensates consisting of synapsin and LV4 () with a magnification of 20. All images were taken 20–30 min after mixing. d Phase diagram for the formation of condensates consisting of LV4 and synapsin. Spheres indicate small spherical fractals, while the ’fractal symbol’ indicates more fractal-like condensates. Fluorescence microscopy images for all concentrations indicated in the diagram are shown in Fig. S2 in the supplementary material. Please note, that the more diffuse fluorescent signal is caused by unfocussed isolated condensates and does not stem from connections between clusters

