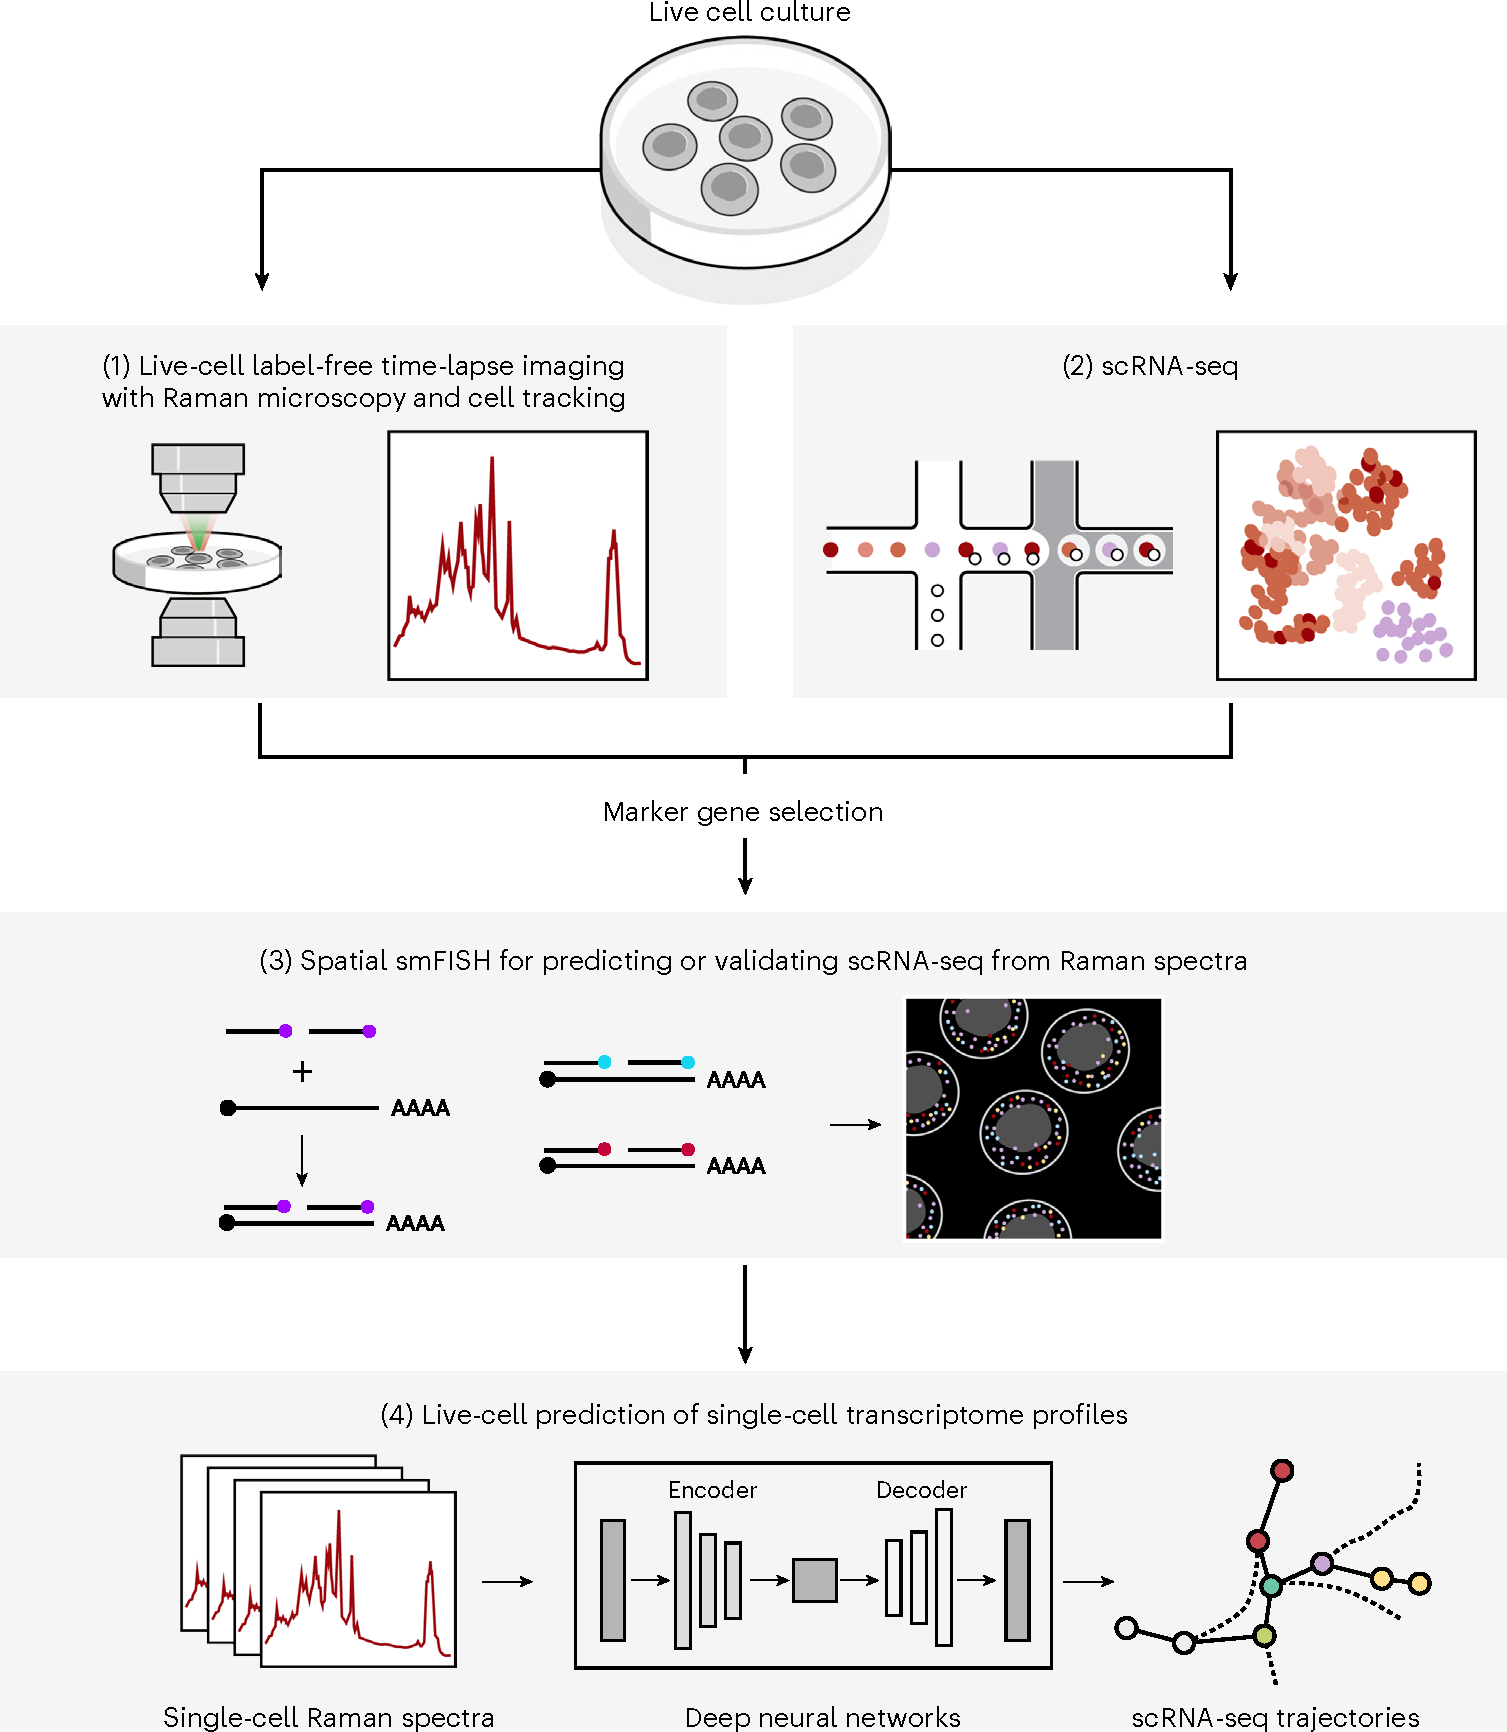
Fig. 1 |. R2R.

Live cells were cultured on gelatin-coated quartz glass-bottom plates (top) and Raman spectra were then measured at each pixel (at subcellular spatial resolution) within an image frame, and after time-lapse imaging and cell tracking (1), smFISH imaging in the same area was carried out (3). In an independent experiment, cells in the same system were dissociated into a single-cell suspension and profiled by scRNA-seq (2). scRNA-seq profiles were used to select nine marker genes for five major cell clusters for mouse iPS cell reprogramming and four marker genes for three major cell lineages in mES cell differentiation, and those were measured with spatial smFISH (3). Lastly, single-cell expression profiles were generated from Raman spectra of individual cells, by either anchor-based (measured by smFISH) or anchor-free methods (4) using fully connected neural networks and AAEs, respectively. Marker gene profiles measured by smFISH are used for either training or validation.
