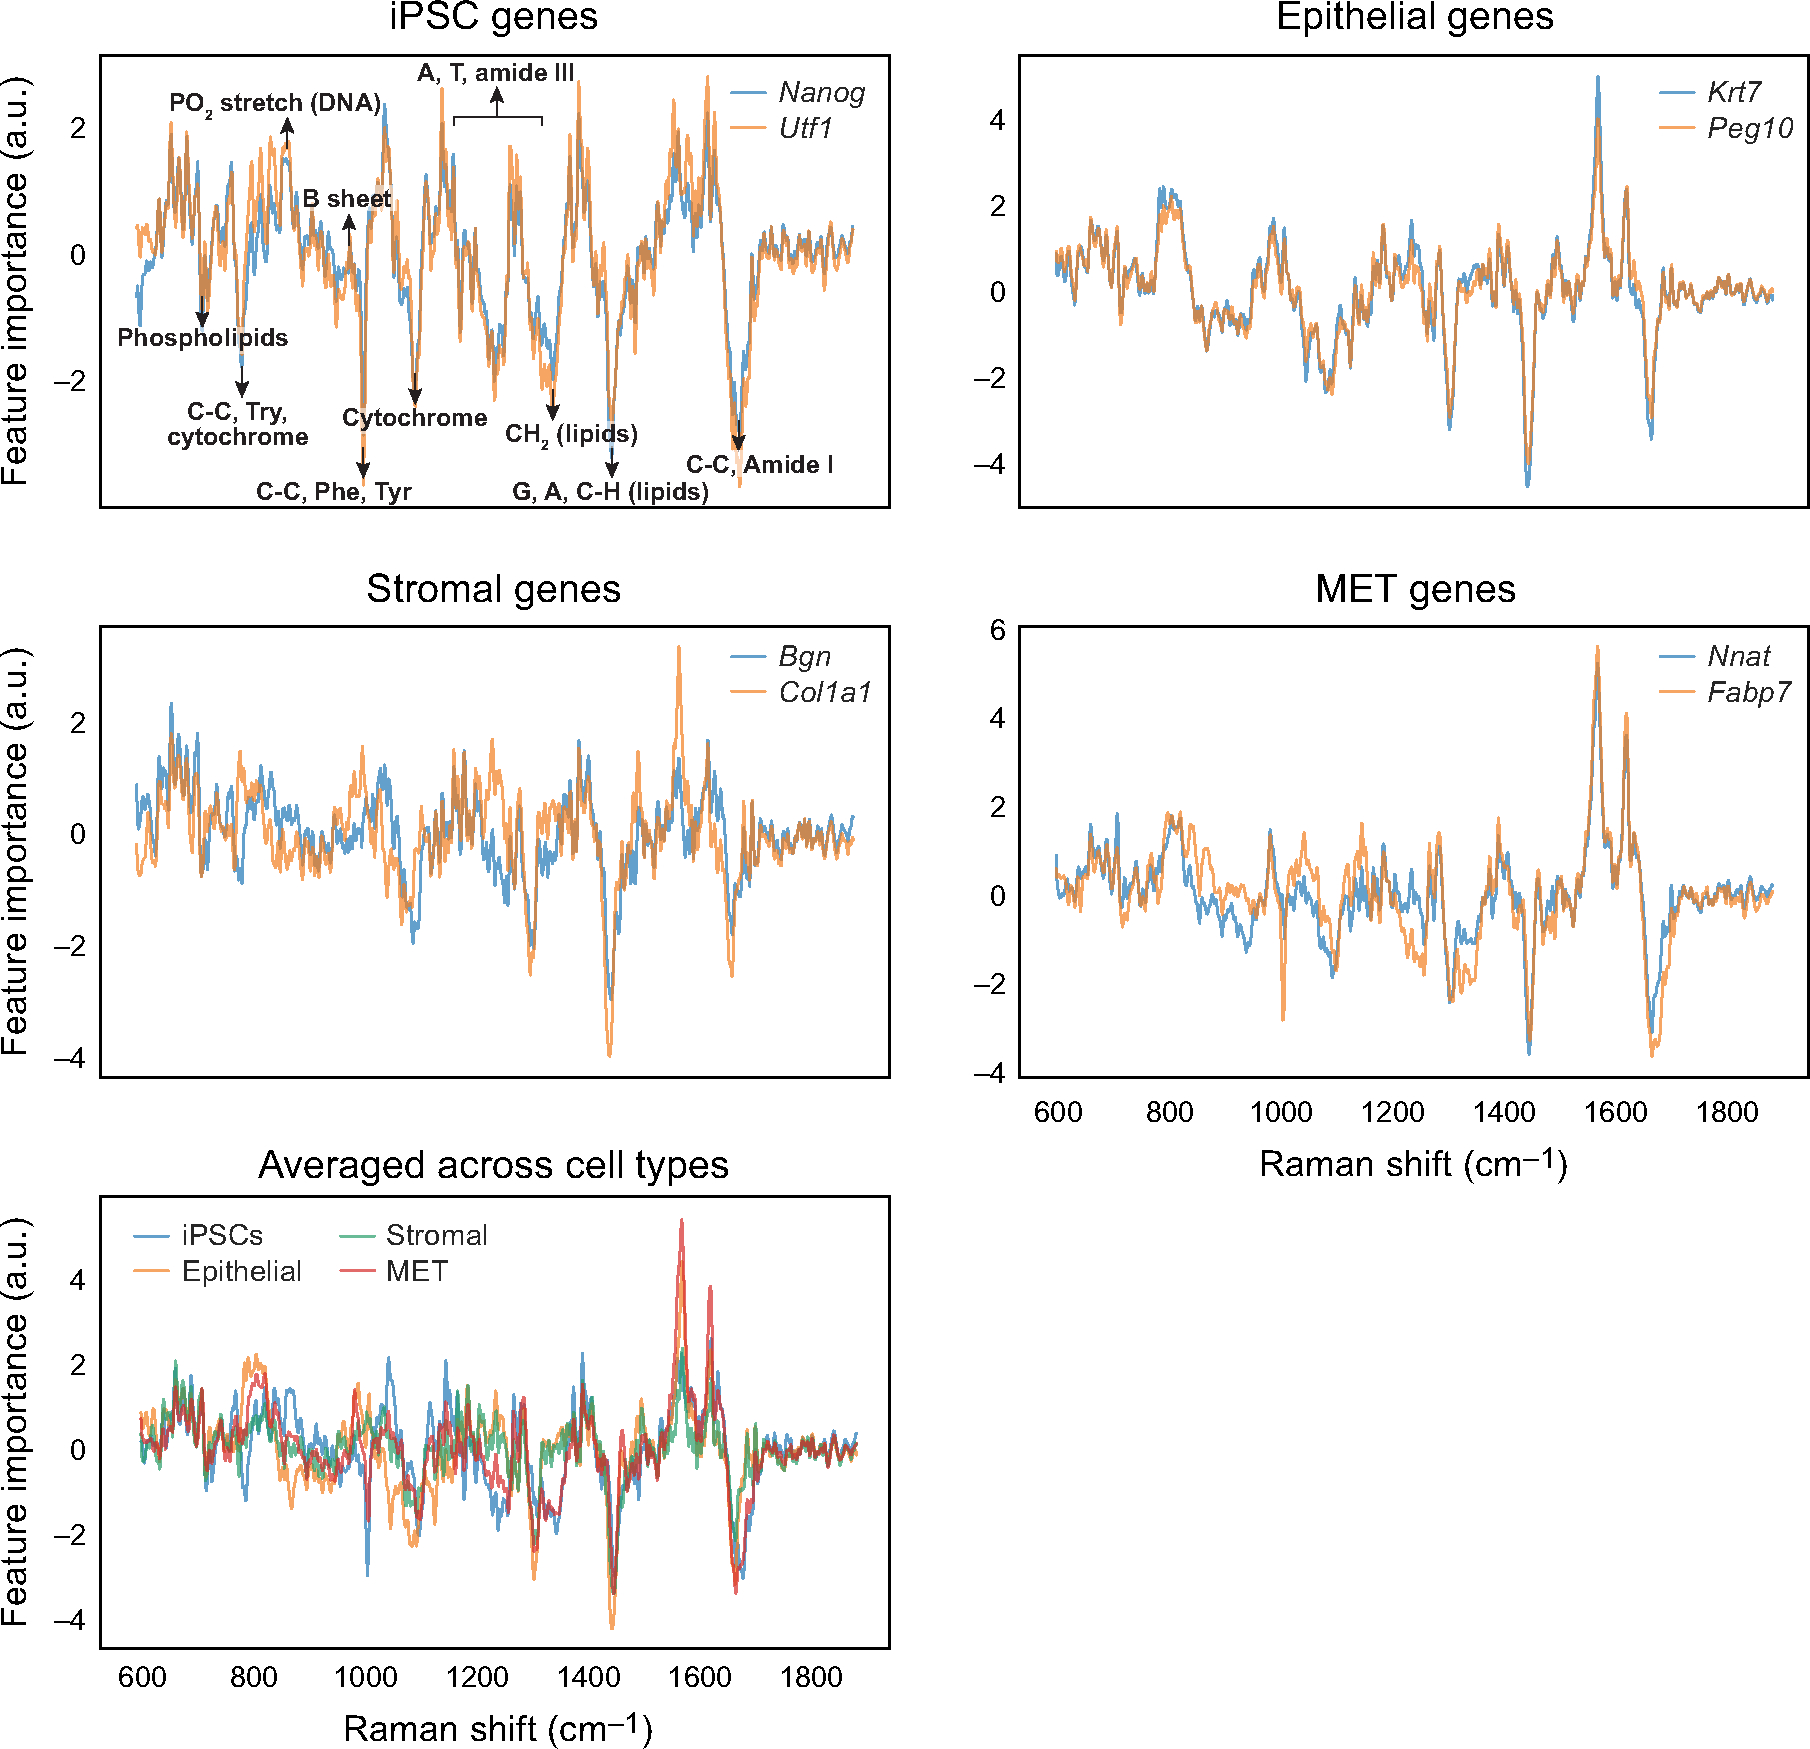
Extended Data Fig. 8 |. Raman spectral feature importance scores for each smFISH anchor gene and its average across all genes for a cell type.

Feature importance scores (y axis) for marker genes of each cell type (top two rows), and for all cell types (bottom row), along the Raman spectrum (x axis). Known signals2 are annotated in the top left panel (identical to Fig. 3j).
