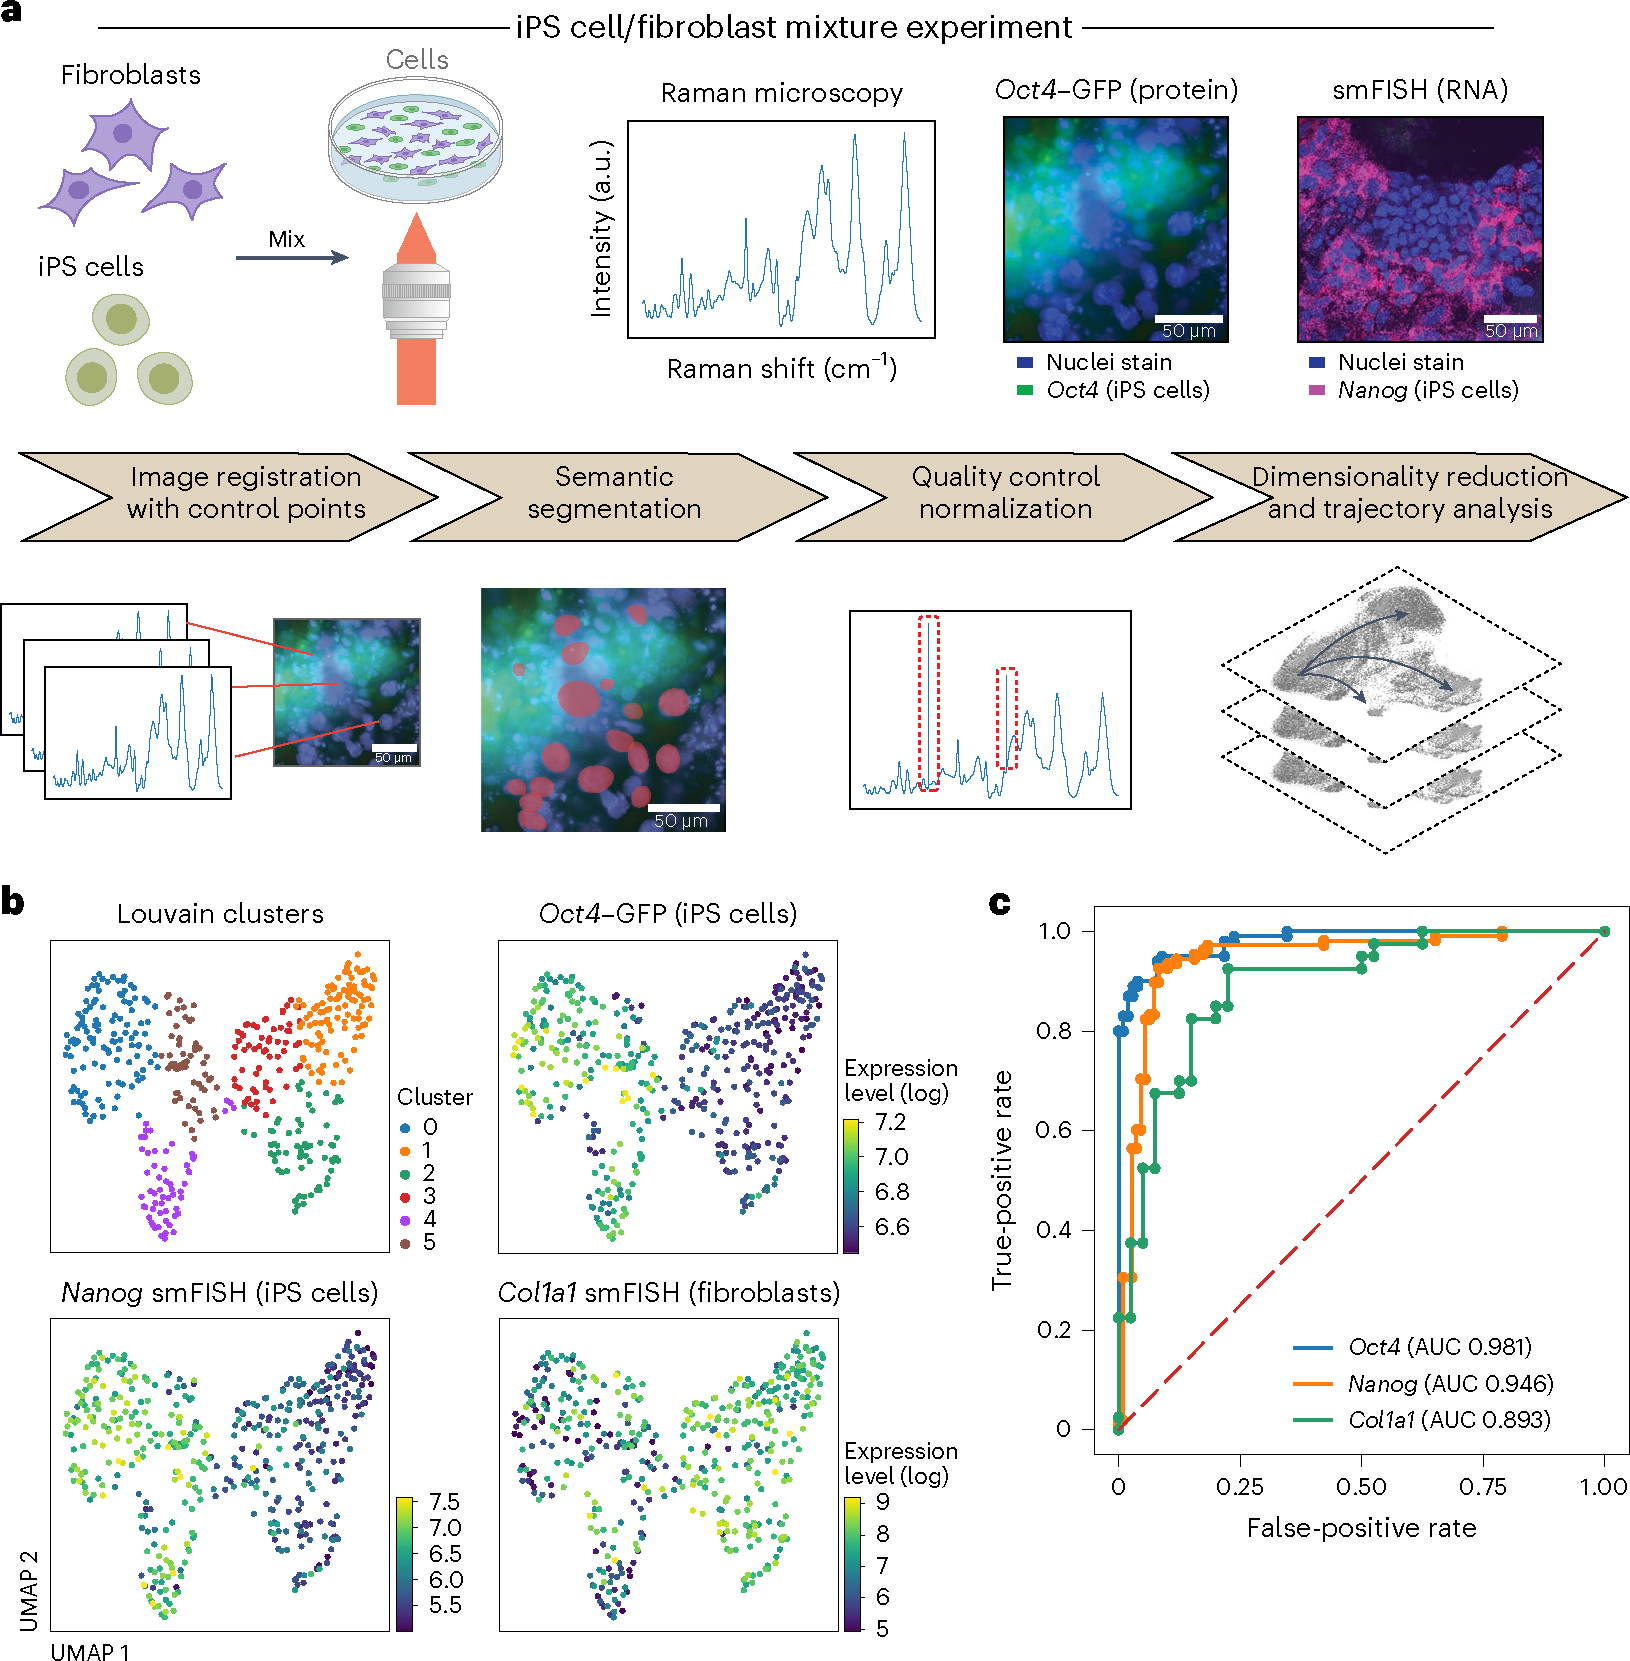
Fig. 2 |. R2R accurately distinguishes cell types and predicts binary expression of marker genes in a mixture of mouse fibroblasts and iPS cells.

a, Overview. Top: experimental procedures. Mouse fibroblasts and iPS cells were mixed 1:1 and plated on glass-bottom plates, followed by Raman imaging of live cells, nucleus staining and measurement of endogenous Oct4–GFP (iPS cell marker) reporter by fluorescence imaging, and cell fixation and processing for smFISH with DAPI and probes for Nanog (iPS cells, magenta) and Col1a1 (fibroblasts). Bottom: preprocessing and analysis. From left: image registration with control points (Methods), followed by semantic cell segmentation, outlier removal/normalization and dimensionality reduction/trajectory analysis. b, R2R distinguishes cell states from Raman spectra. UMAP embedding of single-cell Raman spectra (dots) colored by Louvain clustering labels (top left) or smFISH measured expression of Oct4 (top right), Nanog (bottom left) and Col1a1 (bottom right). c, R2R accurately predicts binary (on/off) expression of marker genes. Receiver operating characteristic (ROC) plots and area under the curve (AUC) obtained by classifying the ‘on’ and ‘off’ states of Oct4 (blue), Nanog (orange) and Col1a1 (green).
