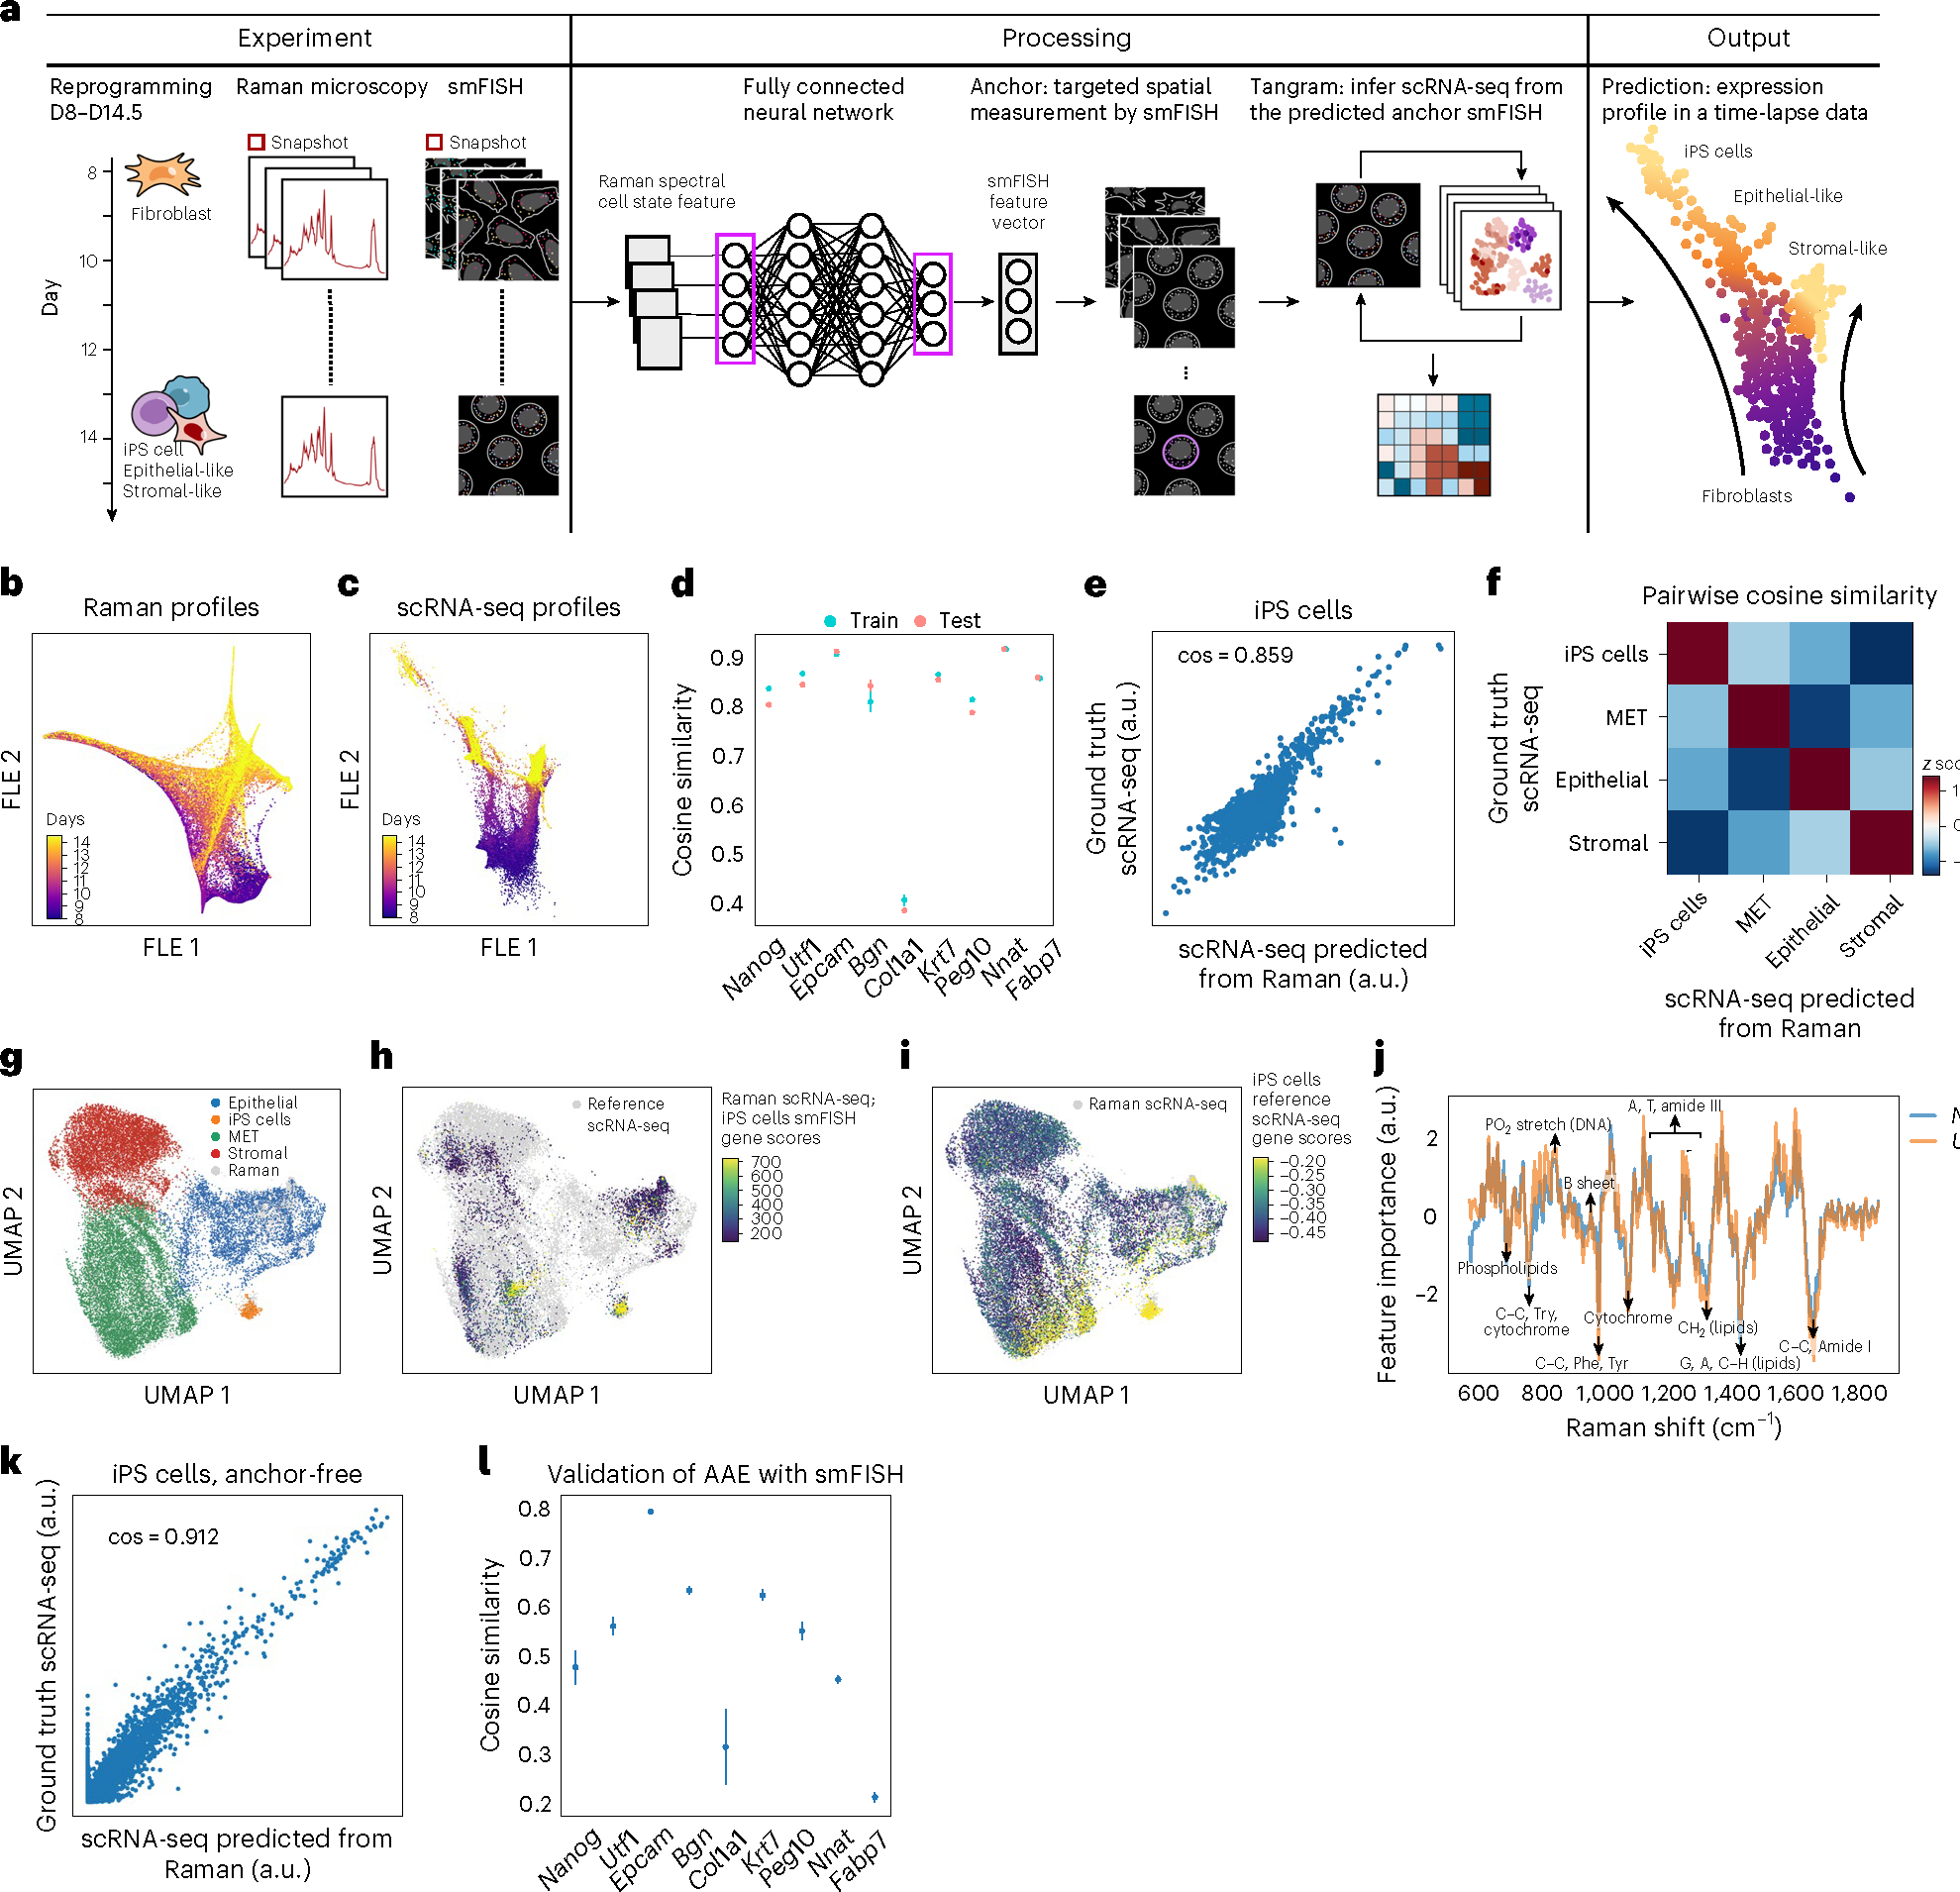
Fig. 3 |. R2R predicts single-cell RNA profiles during reprogramming of mouse fibroblasts to iPS cells.

a, Anchor-based approach overview. From left: mouse fibroblasts were reprogrammed into iPS cells over the course of 14.5 days (‘D’), and, at half-day intervals from days 8 to 14.5, spatial Raman spectra, smFISH for nine anchor genes, and nucleus stains by fluorescence imaging were measured. Domain translation methods (fully connected neural network and Tangram) were used to predict scRNA-seq profiles from Raman spectra using smFISH as anchor. b,c, Low-dimensionality embedding by force-directed layout embedding (FLE) of Raman spectra (b, dots) or scRNA-seq (c, dots) profiles colored by measurement day (color bar). d, Cosine similarity (y axis) between measured (smFISH) and Raman-predicted levels for each smFISH anchor (x axis) in LOOCV where eight out of nine smFISH anchor genes were used for training, and the left-out gene was predicted. Error bars: standard error of five trials with different subset of cells, and mean value at center. e, Measured (y axis) and R2R-generated (x axis) pseudo-bulk RNA profiles (Supplementary Fig. 7) averaged across iPS cells of test cells for each of the top 2,000 highly variable genes (HVGs; dots). f, Pairwise cosine similarity (color bar, z score) between R2R-generated and scRNA-seq measured pseudo-bulk profiles (top 2,000 HVGs) in each cell type (rows, columns). g–i, UMAP co-embedding of R2R-generated RNA profiles on Raman test cells (not used for training) and measured scRNA-seq profiles (dots) colored by cell type annotations (g) or by iPS cell gene signature scores (Methods) of Raman-predicted profiles (h) or of real scRNA-seq (i). j, Feature importance scores of Raman spectra in predicting iPS cell-related marker genes (y axis) along the Raman spectrum (x axis). Known Raman peaks19 were annotated. k, Measured (y axis) and R2R-generated (x axis; anchor-free method) pseudo-bulk RNA profiles averaged across iPS cells for each of the top 2,000 HVGs (dots). l, Cosine similarity (y axis) between measured (smFISH) and anchor-free Raman-generated levels for each smFISH anchor (x axis). Error bars: standard error of five trials with different subset of cells, and mean value at center.
