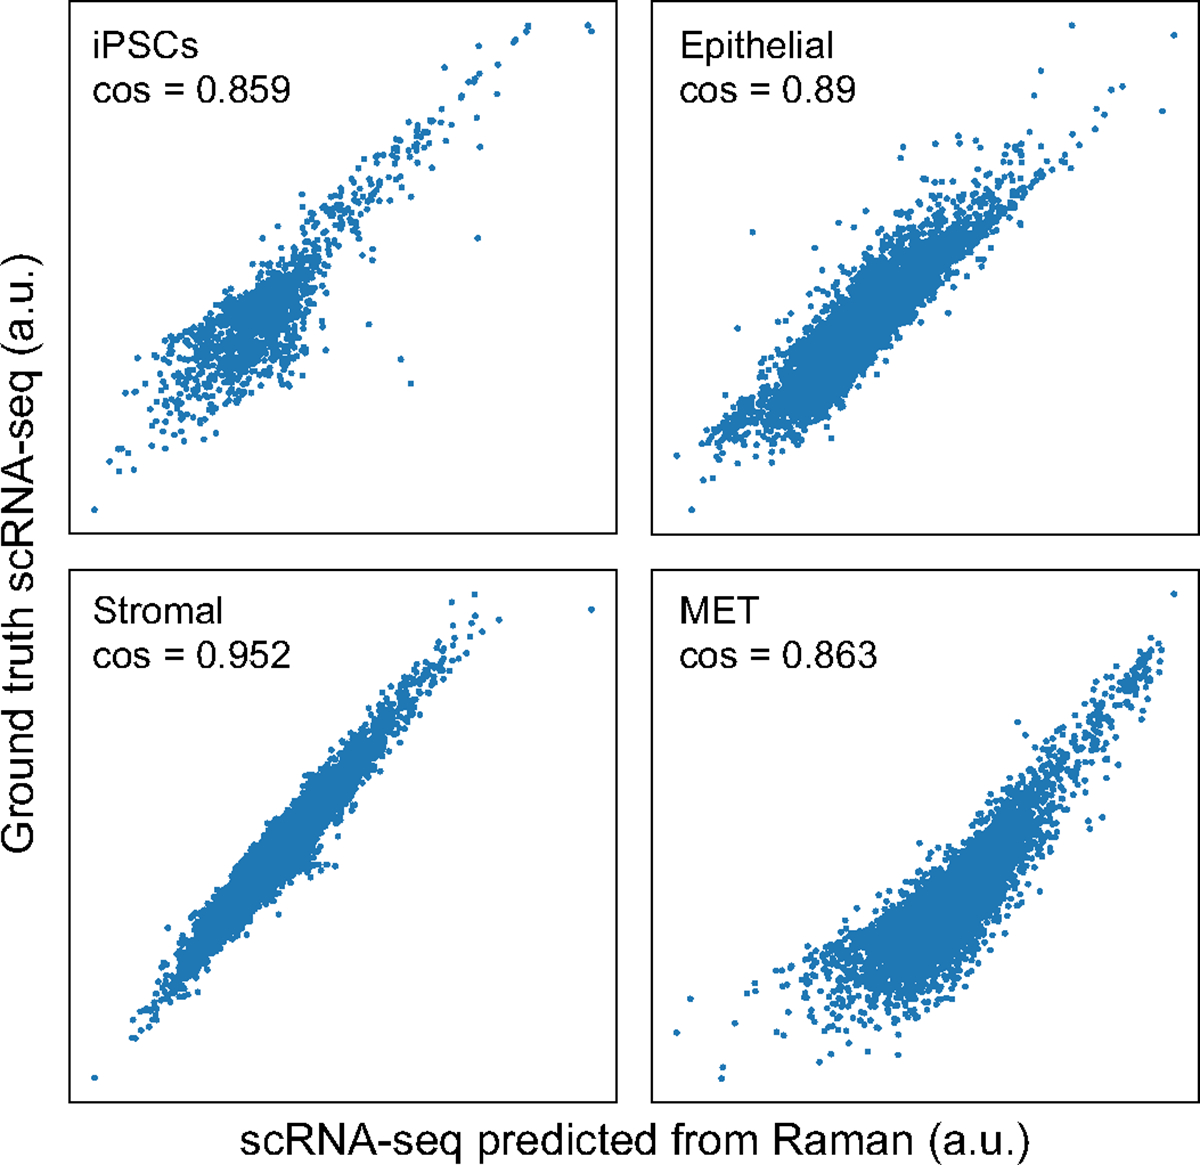
Extended Data Fig. 2 |. Raman-predicted and scRNA-seq measured pseudo-bulk profiles are well correlated across cell types.

scRNA-seq measured (y axis) and R2R-predicted (x axis) expression for each gene (dot) in pseudo-bulk RNA profiles averaged across cells labeled as iPSC (top left), epithelial (top right), stromal (bottom left) and MET (bottom right). Cosine similarity is denoted at the top left corner.
