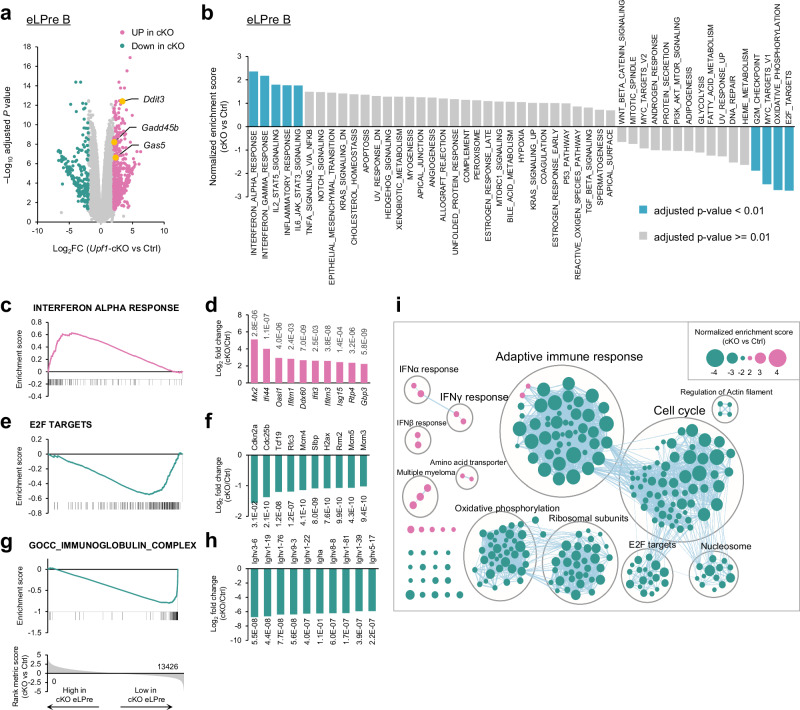
Fig. 2. Transcriptome analysis of Upf1-depleted early LPre-B cell.
a Volcano plot of the genes identified in the RNA-seq analysis of Upf1-cKO and Ctrl early LPre-B cells. Pink dots indicate highly expressed genes in cKO (Log2FC > = 2, adj. P < 0.05), and green dots indicate low expressed genes in cKO (Log2FC < = − 2, adj. P < 0.05). Known NMD targets (Gas5, Gadd45b, and Ddit3) are highlighted in yellow. The statistical analyses were performed using limma. Source data, including exact adjusted p-values, are provided as a Source Data file. b Normalized enrichment score of GSEA using hallmark gene sets. A positive number indicates the gene sets enriched in highly expressed genes in Upf1-cKO early LPre-B cells, and a negative number indicates those enriched in low expressed genes in Upf1-cKO. Significantly enriched gene sets (adj.P < 0.01) are colored in light blue. The statistical analyses were performed using GSEA. c–h Enrichment score plots of “INTERFERON ALPHA RESPONSE” (c), “E2F TARGES” (e), and “IMMUNOGLOBULIN COMPLEX” (g) and bar graph showing Log2FC (Upf1-cKO vs Ctrl) of the representative genes in “INTERFERON ALPHA RESPONSE” (d), “E2F TARGETS” (f), and “IMMUNOGLOBULIN COMPLEX” (H). The top 10 genes showing the highest (d) or lowest (f, h) Log2FC are picked up, and the number adjacent to each bar indicates adj.P. The statistical analyses were performed using limma. i The result of GSEA using all gene sets. Each node indicates identified gene sets and overlapping gene sets are grouped. The size of each dot indicates a normalized enrichment score. Pink and green nodes indicate the gene sets enriched in highly expressed genes and low expressed genes in cKO, respectively.

