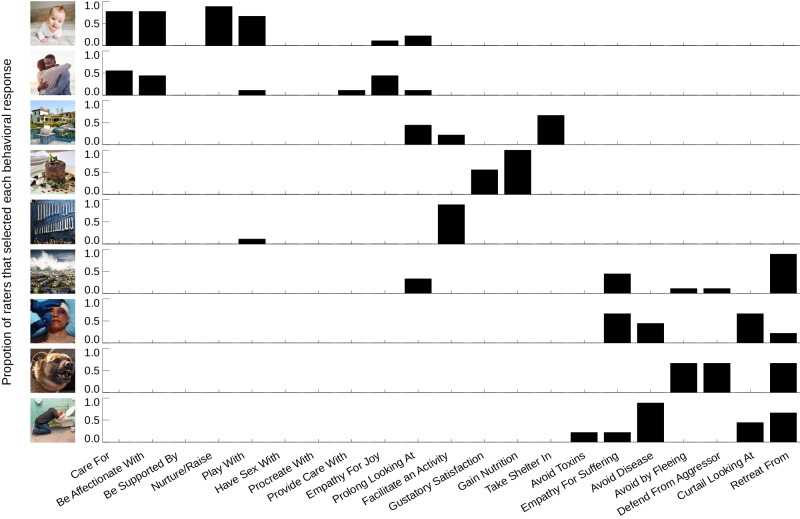
Fig. 8. Behavioral responses matched to image content: example distributions.
Subjects recruited through Amazon’s Mechanical Turk platform were shown the emotional natural images used in this study and asked to select one or more behavioral responses appropriate to the content of each image from a list provided. For each image, we calculated the proportion of MTurk subjects that selected each behavioral response. This is illustrated here for 9 example images1. The behaviors selected between are given on the x axis. Some terms have been abbreviated for illustration purposes (see Methods). In each row, the proportion of subjects selecting each behavior is plotted for a given image. 1Note, where images from our data-set did not have licences allowing for public sharing (including all images containing faces), they have been replaced by highly similar images with such licences in place. See table S4 for source & licensing details.

