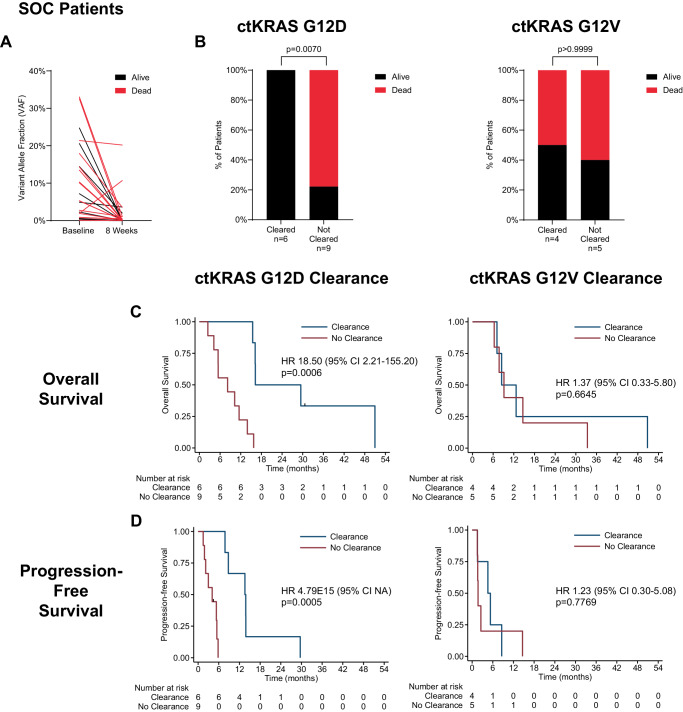
Fig. 5. Survival association with early, on-therapy ctKRAS dynamics by variant for SOC cohort.
Shown is the association with 1-year survival (alive or dead at one year) for therapy-naive SOC patients with any detected baseline ctKRAS mutation as measured by A changes in ctKRAS variant allele fraction (VAF) from baseline to week 8 on therapy (n = 31), or B ctKRAS clearance at week 8 on therapy for G12D only (left) and G12V only (right,). Shown in C is Kaplan–Meyer analysis dichotomized by ctKRAS clearance vs no clearance and association with overall survival for G12D only (left), and G12V only (right). Results for progression-free survival shown in D. Mann–Whitney test (two-sided) used for comparisons in A. Fishers exact test (two-sided) used in B. Cox regression hazard ratios (HR) and 95% confidence intervals (CI) are shown with log-rank p values for C, D. Source data are provided as a Source Data file.

