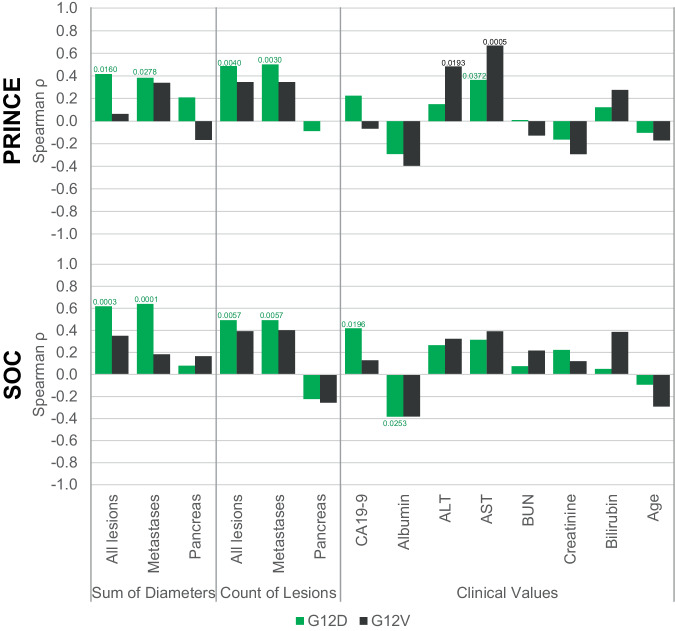
Fig. 6. Correlation of clinical variables with baseline ctKRAS variant allele fraction (VAF) levels for therapy-naive PRINCE and standard of care (SOC) patients.
Shown are results for Spearman correlations (two-sided) for all continuous clinical variables with ctKRAS VAF levels for PRINCE patients (top) and SOC patients (bottom). For each variable, the Spearman ρ is shown for patients with ctKRAS G12D (green bars) and G12V (dark gray bars). “Sum of Diameters” and “Count of Lesions” refer to categories of RECIST imaging measurements (see Methods). Among 56 total PRINCE patients analyzed, 33 have ctKRAS G12D and 23 have G12V. For SOC, the number of patients varies slightly by clinical variable (see Supplementary Table 5 for exact patient numbers). Significant p-values are indicated for the bar over which it appears. If only one bar in a pair has a p-value, that indicates significance for the association of the clinical variable with that particular ctKRAS variant (G12D or G12V) VAF levels but not for the other variant. If a p-value appears over both bars in a pair, that indicates that the association of that clinical variant with ctKRAS VAF for both G12D and G12V was significant. ALT alanine transaminase, AST aspartate transaminase, and BUN blood urea nitrogen are used. Source data are provided as a Source Data file.

