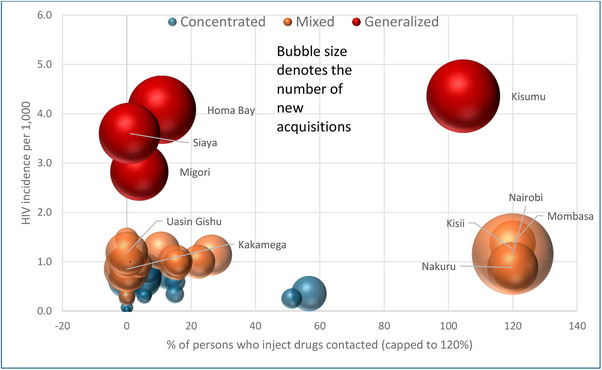
Figure 8.

County‐wise percentage of people who inject drugs contacted by key population programme according to HIV incidence per 1000, epidemic typology and the number of new HIV acquisitions, Kenya, 2021. Note: Only the names of counties with 1000+ new HIV acquisitions are displayed in the figure.
