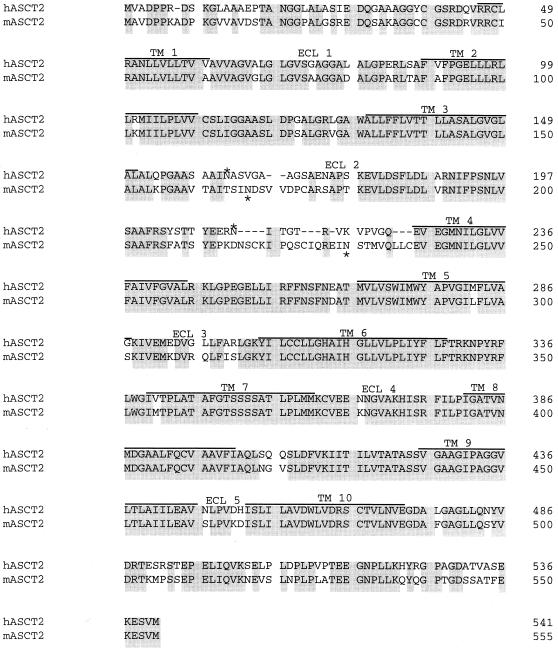
FIG. 1.
Amino acid sequence comparison of hASCT2 with mASCT2. hASCT2 and mASCT2 have 81% sequence identity. Common amino acids are shaded. The 10 hydrophobic potential membrane-spanning domains (TM) are shown as lines over the amino acid sequence and are identified by the numbers 1 to 10. The putative ECL regions are indicated by the numbers 1 to 5. Deletions in sequences are indicated by dashes. The numbers at the right of the sequences correspond to the position of the last amino acid shown. Potential N-glycosylation sites are indicated by asterisks.

