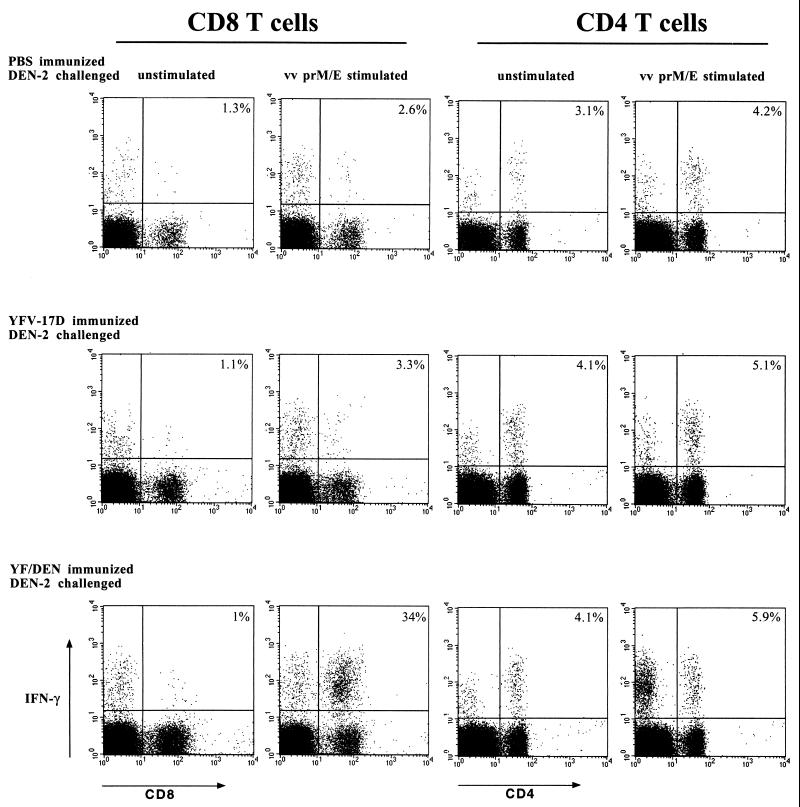
FIG. 6.
CD4 and CD8 T-cell responses in the brains of DEN-2 virus-challenged mice. The results shown are from individual mice and differ slightly from the average frequencies presented in the text. YF/DEN virus-immunized and control mice were challenged by i.c. inoculation of 1.5 × 10⁴ PFU of DEN-2 virus. The frequencies of responding CD4 and CD8 T cells in the brains of the challenged mice were measured 5 days postchallenge by intracellular IFN-γ staining. The frequencies of responding cells are shown as percentages of total CD4 or CD8 T cells. vv, vaccinia virus.

