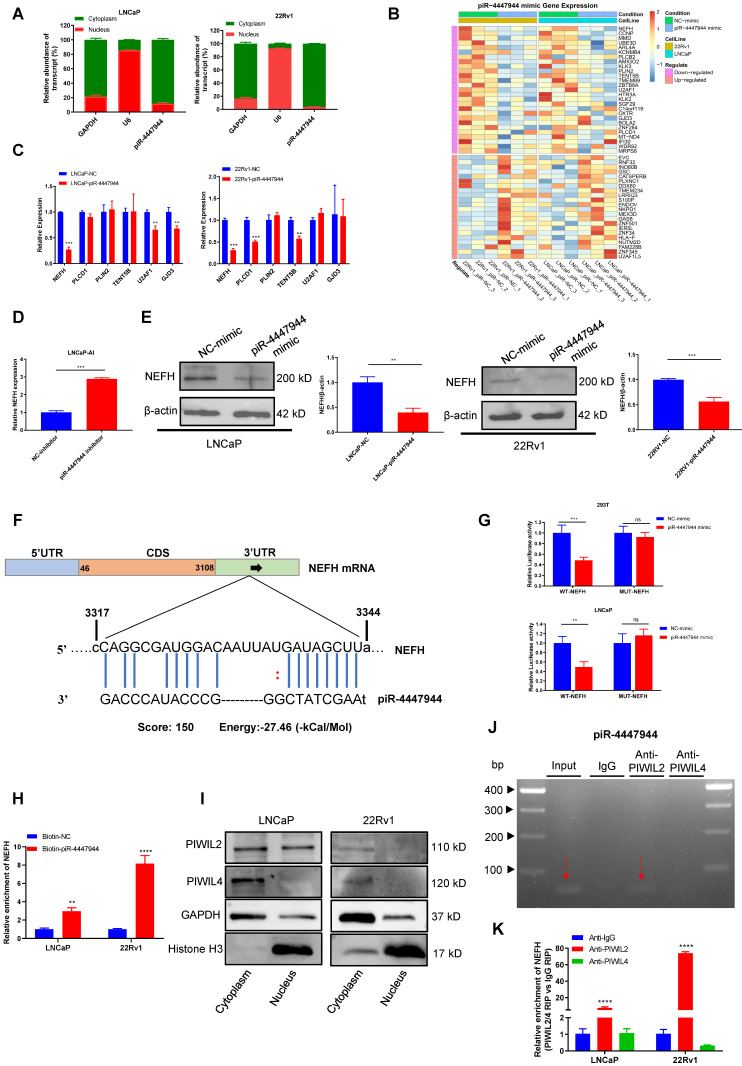
Figure 5.
piRNA binds to PIWIL2 and inhibits tumor suppressor NEFH expression at the posttranscriptional level. A, Subcellular fractionation assay and real-time PCR detected the abundance of piR-4447944 in the nucleus and cytoplasm. GAPDH is the positive control for cytoplasm, and U6 is the positive control for the nucleus. B, Heatmap representing the expression levels of DEGs obtained from mRNA sequencing of LNCaP cells and 22Rv1 cells transfected with NC or piR-4447944 mimic. Each column represents the indicated sample, and each row indicates one DEG. Red and blue colors indicate high or low expression, respectively. The expression value is shown as a Z score of the normalized transcripts per million (TPM). C-D, Validation of the downregulated genes selected from mRNA sequencing results by RT-qPCR. The NEFH mRNA level was significantly decreased in piR-4447944-overexpressed PCa cells, while upregulated in LNCaP-AI cells with piR-4447944 knockdown. E, Western blot showed that piR-4447944 overexpression reduced NEFH protein levels in LNCaP and 22Rv1 PCa cells (left panel), and the quantification of three independent immunoblots was shown in the right panel. F, Potential target binding sites of piR-4447944 within the 3'UTR of NEFH were predicted by miRanda algorithm. G, Dual luciferase assay revealed a direct interaction between piR-4447944 and NEFH. H, RNA pull-down assay showed that NEFH was significantly enriched in the samples pulled down by the Biotin-piR-4447944 probe in LNCaP cells and 22Rv1 cells. I, Expression of PIWIL2 and PIWIL4 in the nuclear/cytoplasmic fraction of PCa cells was analyzed by western blot. J, Specific interaction of piR-4447944 and PIWIL2 protein in LNCaP cells was confirmed by RNA immunoprecipitation (RIP). The red arrow indicated the presence of piR-4447944 in the precipitate detected by electrophoresis after RT-PCR. K, RIP assays confirmed the interaction of PIWIL2 protein with NEFH transcript in LNCaP cells and 22Rv1 cells. Results are presented as mean ± SD. *p < 0.05; **p < 0.01, ***p < 0.001, ****p < 0.0001. Data were obtained from at least three independent experiments.

