Figure 3.
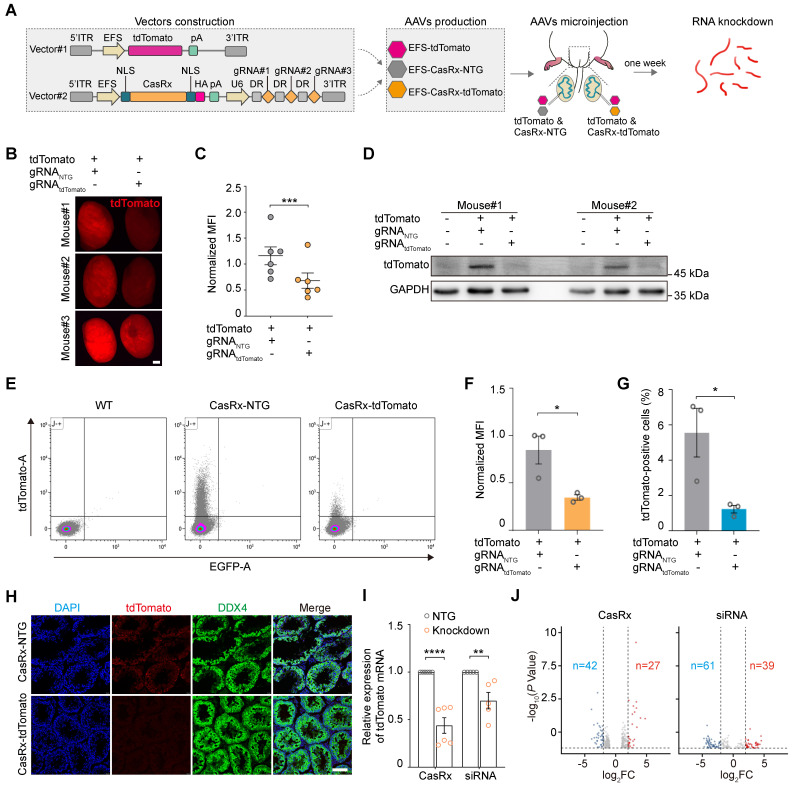
AAV9-mediated CRISPR-CasRx specifically targets reporter mRNA expression in the mouse testis in vivo. (A) Schematic illustration of reporter mRNA knockdown by AAV9-mediated CRISPR-CasRx in vivo. Vector#1 (AAV9-EFS-tdTomato) encodes the tdTomato reporter, driven by the EFS promoter; Vector#2 (AAV9-EFS-CasRx-tdTomato) encodes CasRx and gRNAs. (B) Stereomicroscopic fluorescence imaging of representative testes microinjected with AAV9-EFS-CasRx-tdTomato or AAV9-EFS-CasRx-NTG together with AAV9-EFS-tdTomato. Scale bar: 1 mm. (C) Mean fluorescence intensity (MFI) of tdTomato in testes microinjected with either AAV9-EFS-CasRx-tdTomato or AAV9-EFS-CasRx-NTG together with AAV9-EFS-tdTomato. Data were normalized to the tdTomato-non-targeting condition (n = 6). (D) Western blotting analysis of tdTomato protein expression following AAV9-EFS-CasRx-tdTomato treatment. GAPDH was served as the loading control. Data from two biologically independent samples are shown. (E) Representative flow cytometry dot plot showing the percentage of tdTomato-positive cells in the testes microinjected with AAV9-EFS-CasRx-tdTomato or AAV9-EFS-CasRx-NTG together with AAV9-EFS-tdTomato. (F and G) Flow cytometric analysis of the tdTomato MFI and the percentage of tdTomato+ cells from the testes microinjected with AAV9-EFS-CasRx-tdTomato or AAV9-EFS-CasRx-NTG together with AAV9-EFS-tdTomato. Data were normalized to the tdTomato-non-targeting condition (n = 3). (H) Immunostaining of testicular sections for tdTomato (red) and DDX4 (green). Nuclei were stained with DAPI (blue). Scale bar: 100 μm. (I) qRT-PCR analysis of tdTomato mRNA knockdown efficiency by individual position-matched gRNAs and siRNAs. Data were normalized to Gapdh expression (n >3). (J) Volcano plots of differential transcript levels between tdTomato-targeting and NTG CasRx (left) or tdTomato-targeting and non-targeting siRNA (right) as determined by RNA sequencing. All data are presented as the mean ± SEM. P-values were determined using the two-tailed Student's t-test; *P < 0.05; **P < 0.01; ***P < 0.001; ****P < 0.0001.

