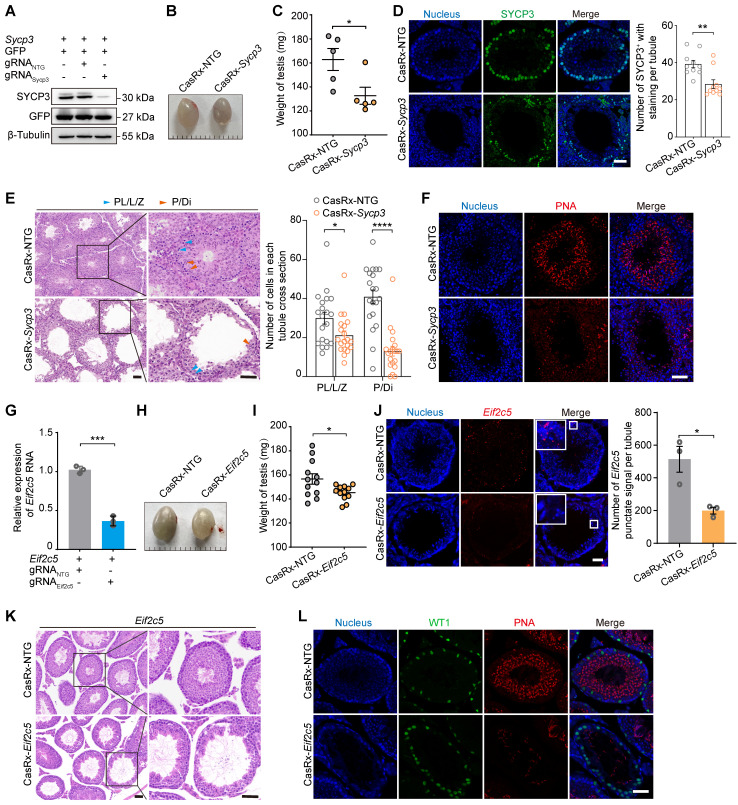
Figure 4.
Transcriptome editing of Sycp3 and lncRNA-Eif2c5 by AAV9-mediated CRISPR-CasRx in the testis in vivo. (A) Western blotting analysis of SYCP3 protein expression in HEK293T cells after CRISPR-CasRx gene editing. GFP was used as transfection control. β-Tubulin was used as a loading control. (B and C) Comparison of the size (B) and weight (C) of testes from control (CasRx-NTG) and SYCP3-depleted (CasRx-Sycp3) mice (n = 5). Scale bar: 1 mm. (D) Immunostaining of testicular sections from the control (CasRx-NTG) and SYCP3-depleted (CasRx-Sycp3) mice for SYCP3 (green). Nuclei were stained with DAPI (blue). Scale bar: 50 μm. Left: representative images; Right: number of stained cells per tubule (n = 10). (E) H&E staining of testicular sections from the control (CasRx-NTG) and SYCP3-depleted (CasRx-Sycp3) mice. Scale bar: 50 μm. Left: representative images; Right: number of Sub-stages of the prophase I spermatocytes (pre-leptotene, leptotene and zygotene spermatocytes [PL/L/Z]; pachytene and diplotene spermatocytes [P/DI]) with staining per tubule (n = 10). (F) Immunostaining of testicular sections from the control (CasRx-NTG) and SYCP3-depleted (CasRx-Sycp3) mice for PNA (red). Nuclei were stained with DAPI (blue). Scale bar: 50 μm. (G) qRT-PCR analysis of lncRNA-Eif2c5 knockdown efficiency in HEK293T cells transfected with vectors expressing Eif2c5, CasRx, and gRNAs. Data were normalized to Actb expression (n = 3). (H and I) The size (H) and weight (I) of testes from the control (CasRx-NTG) and Eif2c5-depleted (CasRx-Eif2c5) mice (n =12). (J) RNAscope analysis of lncRNA-Eif2c5 (red) targeted by AAV9-mediated CRISPR-CasRx in vivo. Nuclei were stained with DAPI (blue). Scale bar: 50 μm. Left: representative images; Right: quantification of Eif2c5 punctate signal per tubule. (K) H&E staining of testicular sections from the control (CasRx-NTG) and Eif2c5-depleted (CasRx-Eif2c5) mice. Scale bar: 50 μm. (L) Immunostaining of testicular sections from the control (CasRx-NTG) and Eif2c5-depleted (CasRx-Eif2c5) mice for WT1 (green) and PNA (red). Nuclei were stained with DAPI (blue). Scale bar: 50 μm. All data are presented as the mean ± SEM. P-values were determined using the two-tailed Student's t-test; *P < 0.05; **P < 0.01; ***P < 0.001.

