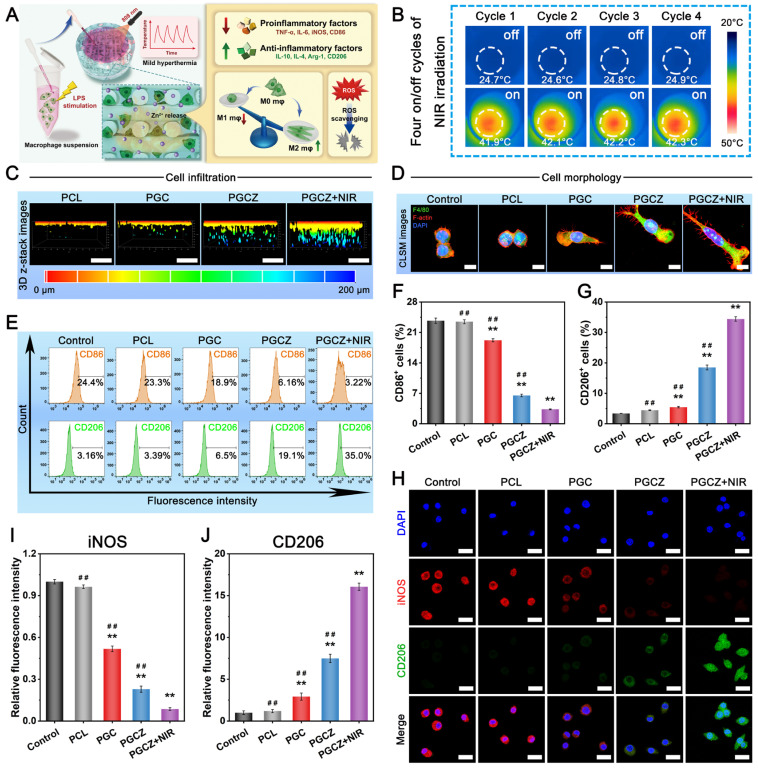
Figure 5.
In vitro immunomodulatory performance. (A) Schematic illustration of immunomodulation induced by the photoactivated PGCZ hybrid scaffold. (B) Infrared thermal images of the cell/scaffold complex during the four on/off cycles of NIR irradiation (1 W/cm2, 808 nm). (C) 3D reconstructed confocal images of macrophages after culturing for 3 days. Scale bar: 200 μm. (D) Confocal immunofluorescence images of cytoskeleton staining for macrophages after co-culturing for 3 days. (red: F-actin; blue: DAPI). Scale bar: 5 μm. (E) Flow cytometry analysis and (F-G) corresponding quantification of macrophage phenotypes after co-culturing for 3 days. (H) Immunofluorescence staining images and (I-J) corresponding quantitative analysis of iNOS and CD206 (red: iNOS; green: CD206; blue: DAPI). Scale bar: 20 μm. Data are presented as the mean ± SD (n = 3). *P < 0.05 and **P < 0.01 indicate significant differences compared with the control group. #P < 0.05 and # #P < 0.01 indicate significant differences compared with the PGCZ+NIR group.

