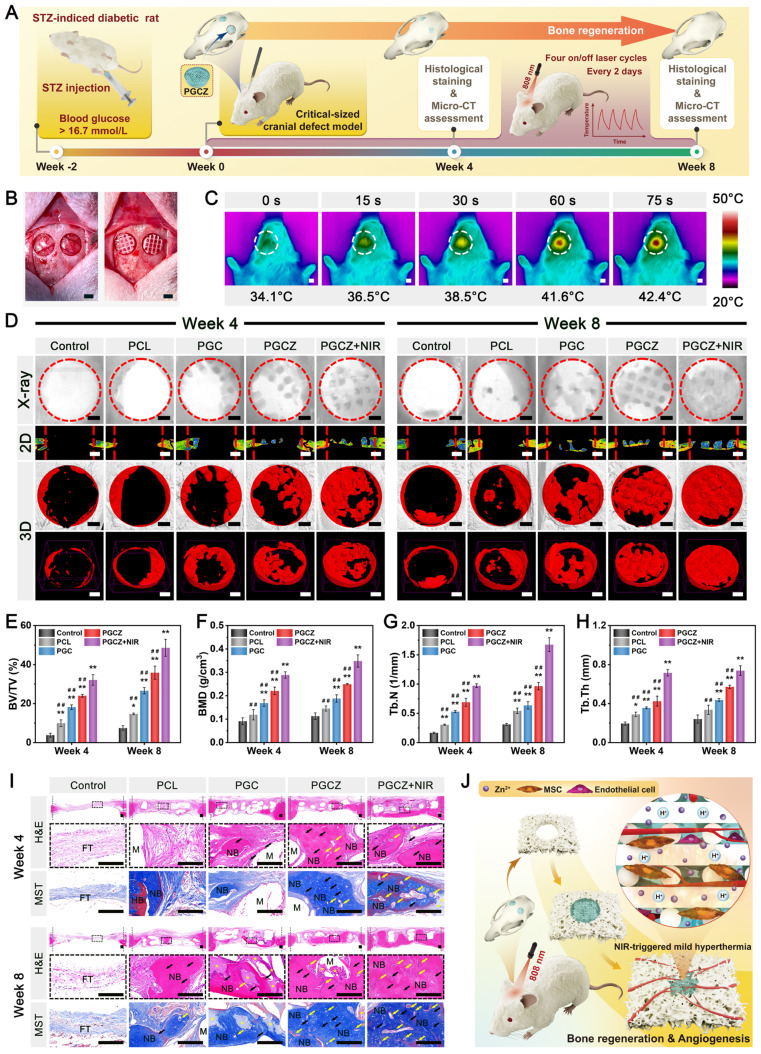
Figure 9.
In vivo bone repair in a diabetic rat cranial defect model. (A) Schematic diagram of the in vivo treatment procedure of cranial defect regeneration under diabetic conditions. (B) Establishment of the calvarial defect model in diabetic rats. Scale bar: 2 mm. (C) Infrared thermal images of the implantation site under NIR irradiation (1 W/cm2, 808 nm). Scale bar: 5 mm. (D) X-ray, 2D, and 3D micro-CT images of the newly formed bone in the defect areas at 4 and 8 weeks after implantation. Scale bar: 1 mm. (E-H) Quantitative analysis of bone morphology parameters, including BV/TV, BMD, Tb.N, and Tb.Th. (I) H&E staining and MST staining images of decalcified bone tissue. FT: fibrous tissue. HB: host bone. NB: newly formed bone tissue. M: residual PCL materials. The black arrows represent the bone lacunae. The yellow arrows represent the central canal. The yellow asterisks represent the residual hydrogel materials. Scale bar: 200 μm. (J) Schematic diagram of bone formation and vascularization in the defect areas under diabetic conditions. Data are presented as the mean ± SD (n = 3). *P < 0.05 and **P < 0.01 indicate significant differences compared with the control group. #P < 0.05 and # #P < 0.01 indicate significant differences compared with the PGCZ+NIR group.

