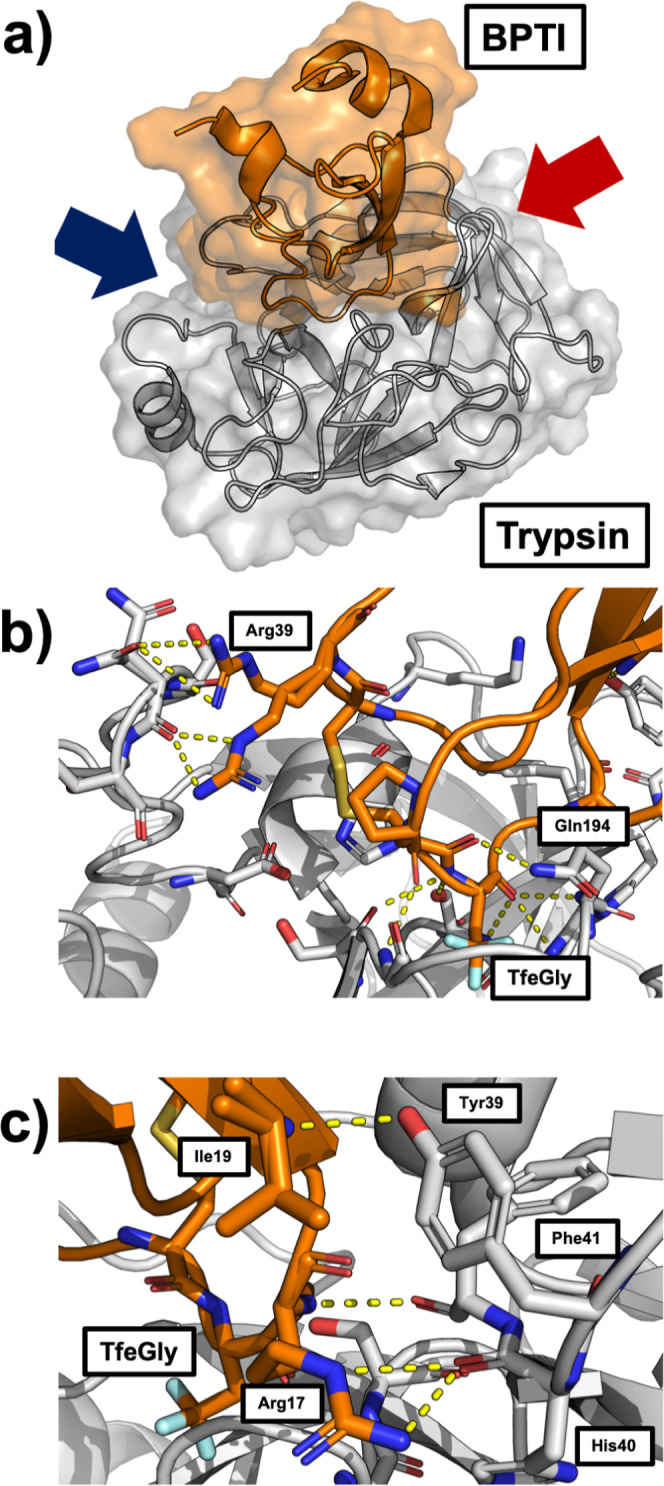
Figure 2.

(a) TfeGly-BPTI–trypsin complex with surface and cartoon representation (pdb code: 4Y11). (b) Protein–protein interface of the complex seen from the perspective of the blue arrow. The interactions around the S1 pocket are to the bottom right and the interactions of Arg39 are on the top left. (c) Protein–protein interface of the complex seen from the red arrow. The interactions of Arg17 (P2′) and Ile19 (P4′) are shown.
