
Figure 4.
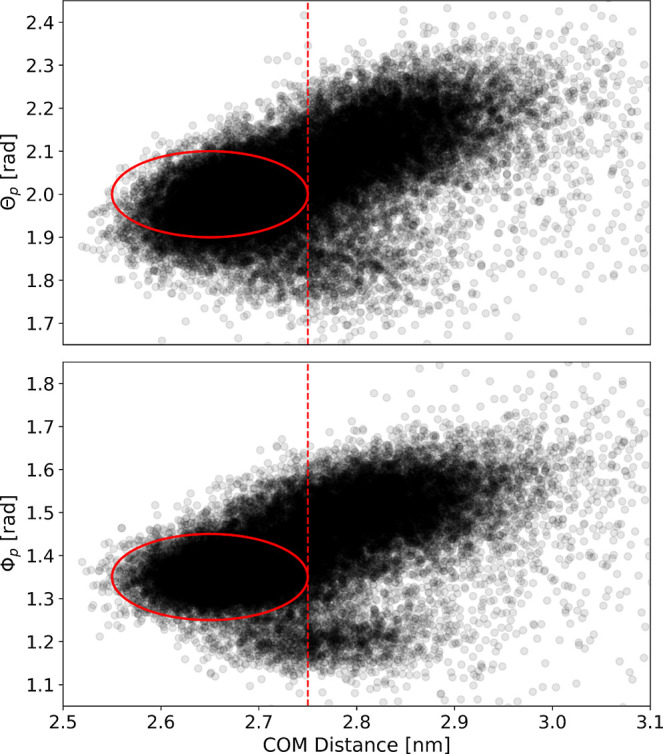
Scatter plots of the center-of-mass distance and Θp (top) and Φp (bottom) for all combined RAMD simulations. The red circle marks the position of the fully bound state.
Official websites use .gov
A
.gov website belongs to an official
government organization in the United States.
Secure .gov websites use HTTPS
A lock (
) or https:// means you've safely
connected to the .gov website. Share sensitive
information only on official, secure websites.
Scatter plots of the center-of-mass distance and Θp (top) and Φp (bottom) for all combined RAMD simulations. The red circle marks the position of the fully bound state.