Fig. 5.
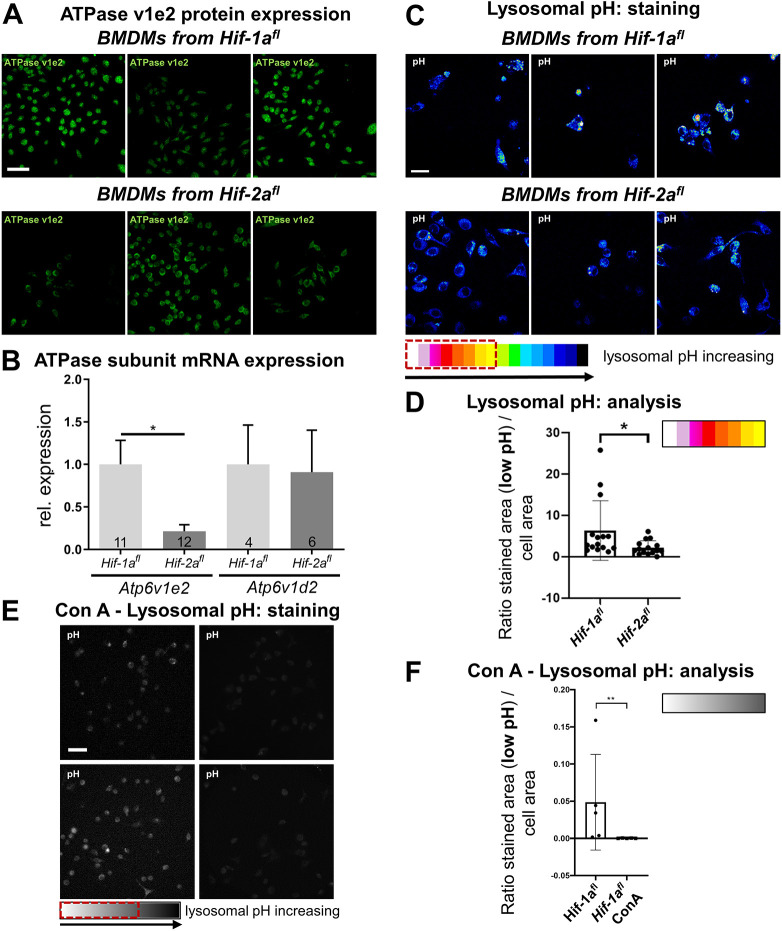
BMDMs from Hif -2afl mice show a reduced expression of the V-ATPase subunit E2 and show a reduced acidification of lysosomes. (A,B) The V-ATPase subunit E2 was immunocytochemically stained in BMDMs from Hif-1afl and Hif-2afl mice. (A) Three representative images from the five independent mice with floxed Hif-1a or Hif-2a that were analyzed are shown. (B) Relative mRNA expression of Atp6v1e2 and Atp6v1d2 in BMDMs from Hif-1afl and Hif-2afl mice. Results are mean±s.e.m. *P<0.05 (two-tailed unpaired Student's t-test). (C,D) The lysosomal pH was examined with LysoSensor™, with increasing yellow to red coloring indicating a lower lysosomal pH. (C) Three representative images from the three independent mice with floxed Hif-1a and Hif-2a that were analyzed are shown. (D) The numbers of marked (red dotted box in C) yellow to white and white pixels color representing acidification within the cell was counted for 15 representative images from each of three independent mice with floxed Hif-1a and Hif-2a. A ratio of these pixels to the total stained area was calculated and is presented as mean±s.d. Floxed Hif-2a mice showed a significantly decreased acidification of lysosomes. **P<0.01 (Mann–Whitney test). A and C are representative images of cells from only one mouse per strain. For representative images of all analyzed individuals please refer to Fig. S1. (E,F) The lysosomal pH was in BMDMs from Hif-1fl mice was examined as in C, with control BMDMs shown in the left two pictures and ConA-treated BMDMs shown in the right two pictures. n=5 pictures from three independent mice for each group. (F) The marked (see red dotted box in E) white to grey numbers of pixels was counted for five representative images from BMDMs of three independent floxed Hif-1a mice with and without ConA treatment. A ratio of these pixels to the total stained area was calculated and is shown as mean±s.d. ConA-treated cells showed a significantly decreased acidification of lysosomes. **P<0.01 (Mann–Whitney test). Scale bars: 40 μm (A), 20 μm (C,E).

