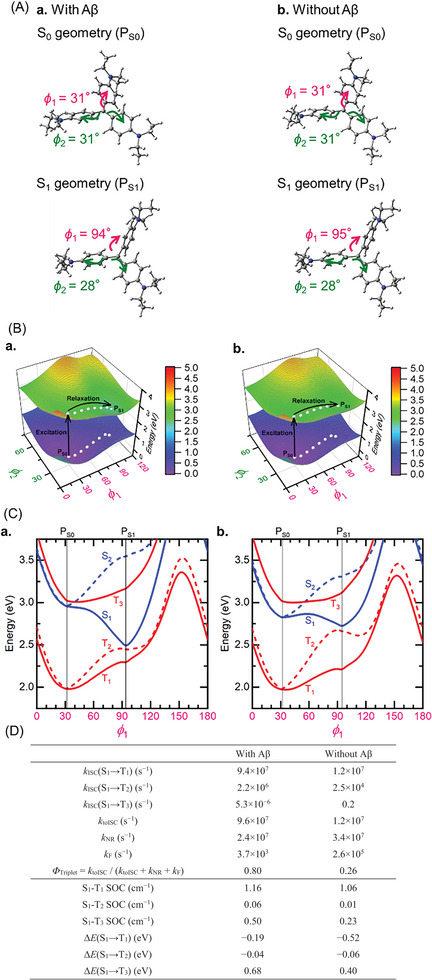
Figure 3.

DFT calculation of EV (3). A) Optimized S0 and S1 geometries calculated using the M06‐2X/6‐31G(d) and TDA‐M06‐2X/6‐31G(d) methods, respectively. (a) 3 with binding Aβ (ε r = 1); (b) 3 without binding Aβ (ε r = 78). B) Potential energy surfaces for the ground state (S0) and lowest excited singlet states (S1). (a) 3 with binding Aβ (ε r = 1); (b) 3 without binding Aβ (εr = 78). White dots depict geometry relaxation paths. C) Potential energy curves for the excited singlet states (S1 and S2) and excited triplet states (T1, T2, and T3) calculated along the decay paths in Figure 3B. (a) 3 with binding Aβ; (b) 3 without binding Aβ. D) Rate constants for ISC (k ISC), non‐radiative decay (k NR), and fluorescence (k F), spin–orbit couplings (SOCs), and excited‐state energy differences (ΔE), calculated at the TDA‐M06‐2X/6‐31G(d) level of theory.
