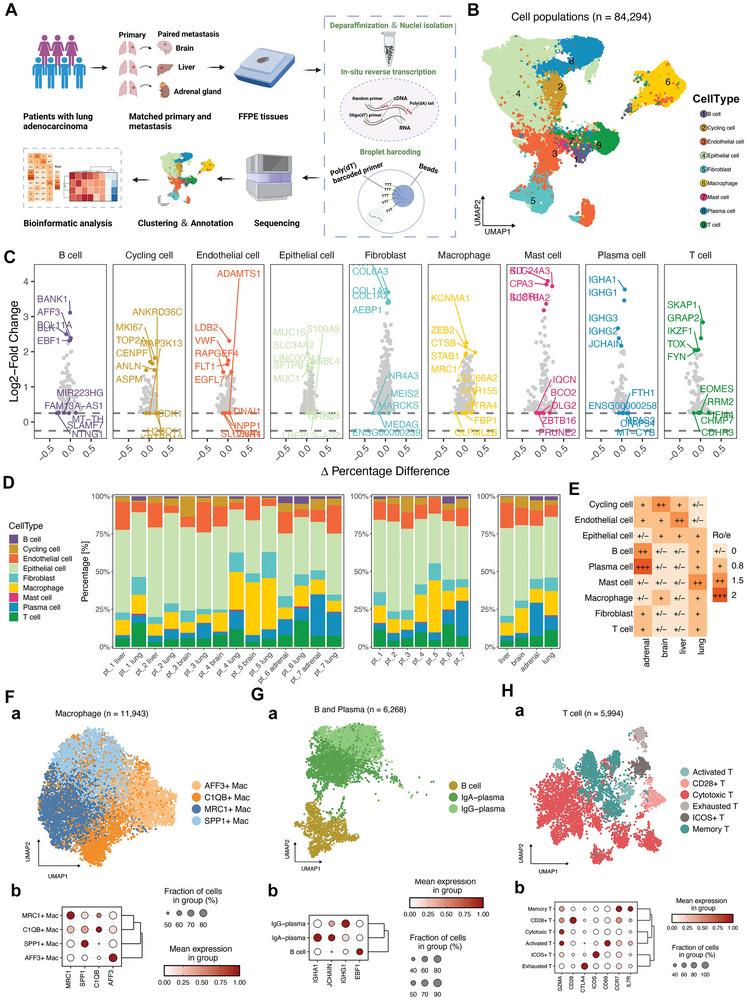
Figure 1.

High‐resolution tumor microenvironment atlas of paired primary LUAD and metastases in the brain, liver, and adrenal gland depicted by scRandom‐seq. A) Overview of the design for snRandom‐seq. FFPE samples from paired primary and metastatic lesions were collected for single‐cell nuclei transcriptomic sequencing. B) UMAP plot of major cell types from all the samples. C) The mean expressions of canonical marker genes for the major clusters. D) The frequency of each cell cluster presented as a proportion of total cells in each sample. E) Tissue prevalence of each cell cluster estimated by the Ro/e analysis. F–H) UMAP plots of macrophages, B and plasma cells, and T cells show distinct subclusters. Dot plots of expression levels of classical markers for each subclusters.
