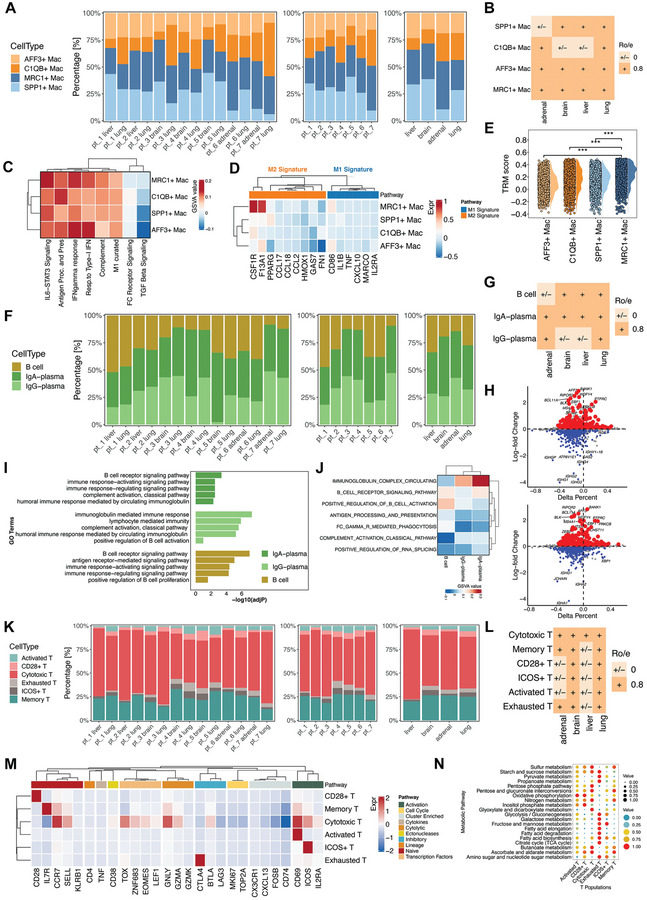
Figure 2.

Diversity of macrophages, B and plasma cells, and T cells in the LUAD TME of different anatomical sites. A) The frequencies of the macrophage subclusters in each sample. B) Tissue prevalence of each macrophage subcluster estimated by the Ro/e analysis. C) The potential biological functions and relevant signaling pathways of the four macrophage subclusters were evaluated by the ssGSEA according to the hallmark gene sets. D) The enrichment of M1‐ and M2‐macrophage‐related pathways in the four macrophage subclusters. E) Half violin plots showing the tissue‐resident macrophage scores of the subclusters. F) The frequencies of the B and plasma cell subclusters in each sample. G) Tissue prevalence of each B and plasma cell subcluster estimated by the Ro/e analysis. H) The volcano plots show differently expressed genes of the IgA‐ and IgG‐plasma cells compared to the B cells. I,J) The potential biological functions and relevant signaling pathways of the B and plasma cell subclusters were evaluated by the GO and ssGSEA analyses according to the hallmark gene sets. K) The frequencies of the T cell subclusters in each sample. L) Tissue prevalence of each T cell subcluster estimated by the Ro/e analysis. M) The expression of canonical markers and relevant signaling pathways of the six T cell subclusters were evaluated by the ssGSEA based on hallmark gene sets. N) Dot plots of median metabolic pathway scores of the six T cell subclusters.
