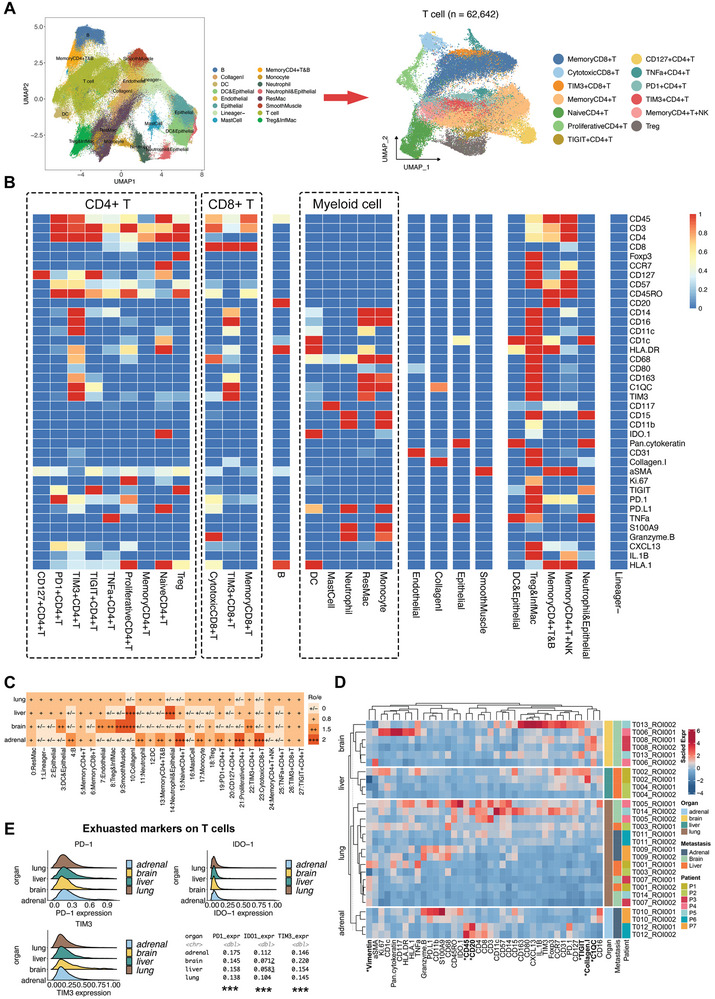
Figure 4.

The divergent organ‐specific TME of LUAD detected by IMC techniques. A) The UMAP plots for major clusters and T cell subsets based on single‐cell data of 250 600 cells from IMC images. B) The heatmap presents the normalized expression levels of indicated markers for each cluster. C) Tissue prevalence of each cluster on IMC images estimated by the Ro/e analysis. D) The heatmap of scaled marker expressions in each specimen from different metastases. E) The expression levels of exhausted markers on T cells in each anatomic site of LUAD.
