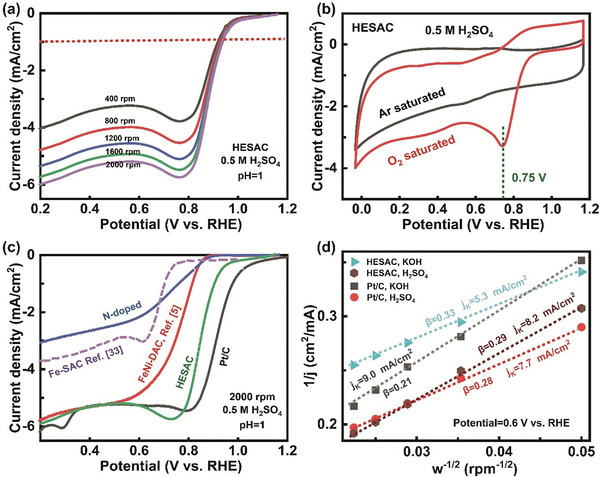
Figure 7.

ORR performance. a) LSV polarization curves of FeCoNiRu‐HESAC in the acidic (0.5 m H2SO4) electrolyte for various rotation speeds of 400, 800, 1200, 1600, and 2000 rpm. b) CV curves obtained in Ar‐ and O2‐saturated acidic electrolyte, showing a prominent ORR peak at 0.75 VRHE representing the reduction of O2 with the FeCoNiRu‐HESAC. c) LSV polarization curves of Pt/C, FeCoNiRu‐HESAC, Fe‐SAC (ref. [34]), FeNi‐DAC (ref. [5]), and nitrogen‐doped samples in the acidic (0.5 m H2SO4) electrolyte for the rotation speed of 2000 rpm. d) K–L plot at the applied potential of 0.6 VRHE for FeCoNiRu‐HESAC and Pt/C samples in the acidic (0.5 m H2SO4) and alkaline (0.1 m KOH) electrolytes, with satisfactory linearity and comparable kinetic current densities (jK). All LSV polarization curves are obtained in an O2‐saturated electrolyte.
