
Figure 5.
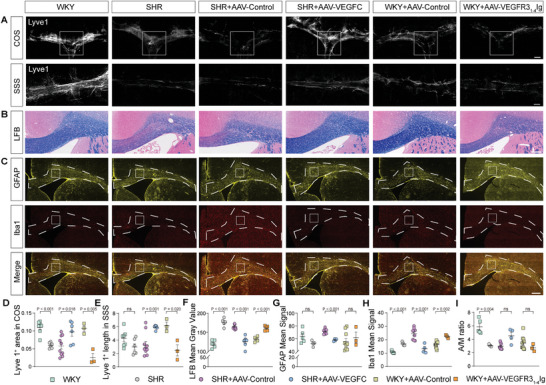
Pathological changes in meningeal lymphatic vessels (mLVs) and corpus callosum (CC) in rats. A) Representative pathological images of mLVs stained with lymphatic vessel endothelial hyaluronan receptor 1 (Lyve1) 647 (in gray) in the meningeal confluence of sinuses (COS) and superior sagittal sinus (SSS), shown in dashed rectangle box. Scale bar = 1000 µm. B) Representative pathological images showing myelin sheath stained with Luxol Fast Blue (LFB) in CC. C) Representative images of glial fibrillary acidic protein (GFAP) (in yellow) and Ionized calcium binding adapter molecule 1 (Iba1) (in red) staining in brain sections. Scale bar = 500 µm. D–E) Quantification of fluorescence intensity, expressed as Lyve1+ covered area and length of Lyve1+ immunoreactivity in D) COS and E) SSS. Data for SHR: n = 6, SHR+AAV‐VEGFC: n = 6, SHR+AAV‐Control: n = 10, WKY: n = 7, WKY+AAV‐VEGFR31‐4‐Ig: n = 3, WKY+AAV‐Control: n = 3. Pooled data from two independent experiments. F) Quantification of demyelination in CC. Scale bar = 300 µm. SHR showed a significantly decreased optical density (i.e., an increased mean gray value) compared to WKY. Data for SHR: n = 5, SHR+AAV‐VEGFC: n = 7, SHR+AAV‐Control: n = 10, WKY: n = 6, WKY+AAV‐VEGFR31‐4‐Ig: n = 5, WKY+AAV‐Control: n = 5. Pooled data from two independent experiments. G–I) Quantification of fluorescence intensity of G) GFAP, H) Iba1 and GFAP/Iba1 ratio (A/M ratio, I) immunoreactivity, expressed as mean signal in a fixed square region. Data for SHR: n = 4, SHR+AAV‐VEGFC: n = 4, SHR+AAV‐Control: n = 9, WKY: n = 5, WKY+AAV‐VEGFR31‐4‐Ig: n = 3, WKY+AAV‐Control: n = 10. Pooled data from two independent experiments. All error bars represent mean ± s.e.m. P values were calculated by two‐tailed unpaired Student's t‐test or Welch's t‐test.