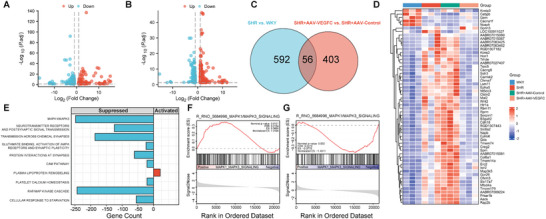
Figure 7.

The effect of vascular endothelial growth factor C (VEGF‐C) overexpression on the gene expression profile and functional changes in the corpus callosum. RNA‐seq analysis. n = 3 per group. A) Volcano plot displaying a total of 648 significant differentially expressed genes (DEGs) with 204 downregulated genes (blue dots) and 444 upregulated genes (red dots) in the spontaneously hypertensive rats (SHR) versus Wistar‐Kyoto rats (WKY) group. Significant DEGs were considered at a threshold with an absolute value of log2 fold change (log2 FC) greater than 1 and an adjust p‐value less than 0.05. B) Volcano plot illustrating a total of 459 DEGs with 227 downregulated genes (blue dots) and 232 upregulated genes (red dots) in the AAV2/9‐CMV‐rVEGF‐C treated SHR (SHR+AAV‐VEGFC) versus AAV2/9‐control treated SHR (SHR+AAV‐Control) group. C) Venn diagram revealing intersected genes. D) Heatmap showing DEGs among the groups to identify genes that were altered in SHR but recovered to the levels of the WKY group by VEGF‐C overexpression. E) Gene set enrichment analysis (GSEA) conducted to examine functional changes caused by VEGF‐C overexpression. F) GSEA plot showing the MAPK1/MAPK3 signaling pathway was activated in SHR compared to WKY. NES = 1.319, NOM p‐val = 0.012, FDR q‐val = 0.215. G) GSEA plot demonstrating the MAPK1/MAPK3 signaling pathway was suppressed after AAV2/9‐CMV‐rVEGF‐C treatment in SHR. NES = ‐1.434, NOM p‐val = 0.001, FDR q‐val = 0.21.
