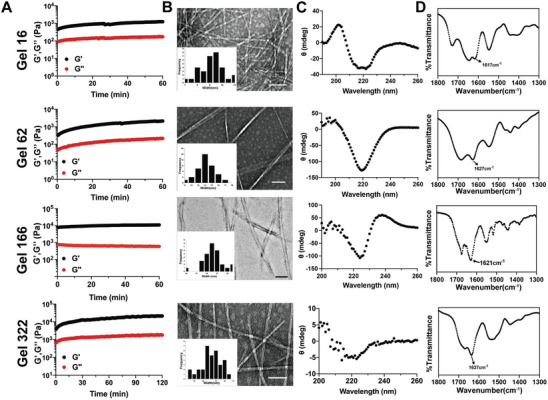
Figure 4.

Biophysical characterization of hydrogel 16, 62, 166, 322. A) Rheological dynamic time sweep monitors the storage modulus (G’) and loss modulus (G’’) of different hydrogels as a function of time B) Representative TEM images reveal the morphologies of selected hydrogels, insets are distribution of nanofibers width (scale bar = 100 nm). C) CD spectra of hydrogels suggested the formation of β‐sheet structure. D)FT‐IR spectra of hydrogels further confirmed their specific secondary structures.
