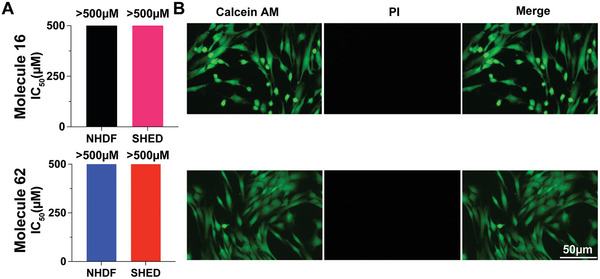
Figure 5.

Cell compatibility analysis of compound 16 and 62. A) IC50 of NHDF and SHED cells treated with molecule 16 (top panel) and 62 (bottom panel) for 24 h. B) Live/dead assays of cells grown on the surface of hydrogel 16 (right of top panel) or 62 (right of bottom panel) for 24 h showing high biocompatibility with SHED cultures. Living cells show positive staining with calcein AM (green), while dead or compromised cells are stained with propidium iodide (PI, red). Each column represents three individual experiments (n = 3).
