
FIG. 2.
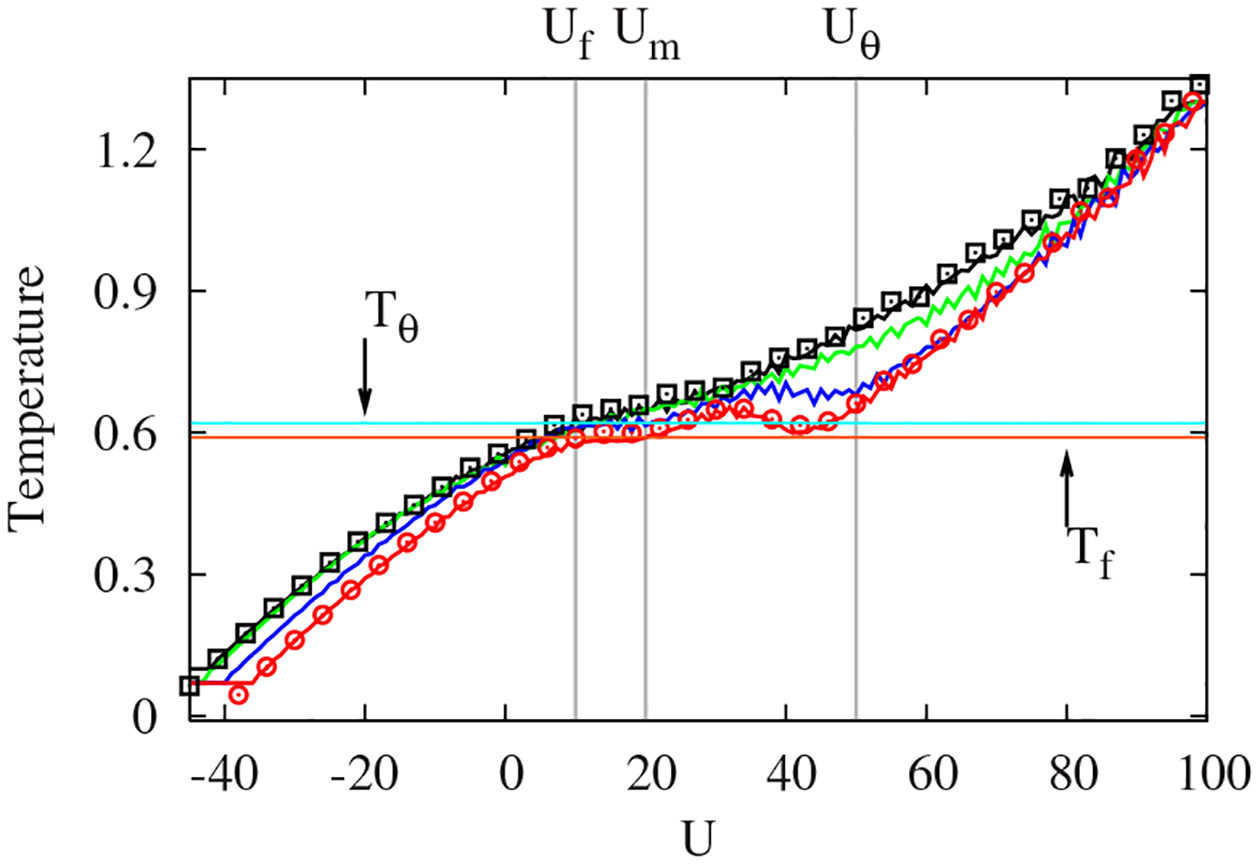
(Color online) Statistical temperatures (solid lines) and configurational temperatures (squares and circles) with different , and 0 from top to bottom at . Note that horizontal lines at and match the backbending and plateau regions of at , respectively.