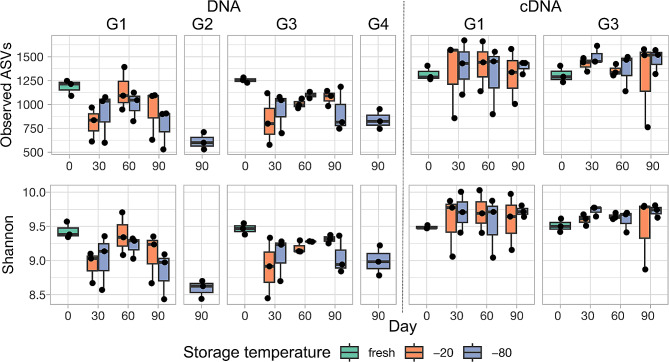
Fig. 1.
Measurement of alpha diversity indices (observed species, Shannon diversity) for DNA and cDNA-based analysis. G1 = small (300 µl or 1.5 ml) aliquots with saline only buffer; G2 = 1-liter aliquot with saline only buffer; G3 = small aliquots with saline plus glycerol buffer; G4 = 1-liter aliquot with saline plus glycerol buffer. X-axis shows the day of storage (Day 0 or fresh, 30, 60, or 90). The different colors represent the storage temperature (fresh, frozen at -20 °C, or frozen at -80 °C). Each box and whisker plot shows results for 3 samples (1 from each horse), as represented by the individual data points. Alpha diversity indices for cDNA-based analysis showed much less variation between day and temperature of storage (P > 0.05) than for DNA-based analysis (P < 0.001 for fixed effect of day for both − 20 °C and − 80 °C), and the frozen samples were overall more similar to fresh samples than for DNA-based analysis. There was less variation in alpha diversity between horse for cDNA-based analysis when using saline plus glycerol buffer as compared to saline only buffer. For the 1-liter aliquot size, less variation was seen when using saline plus glycerol buffer as opposed to saline only buffer (only DNA-based analysis performed)

