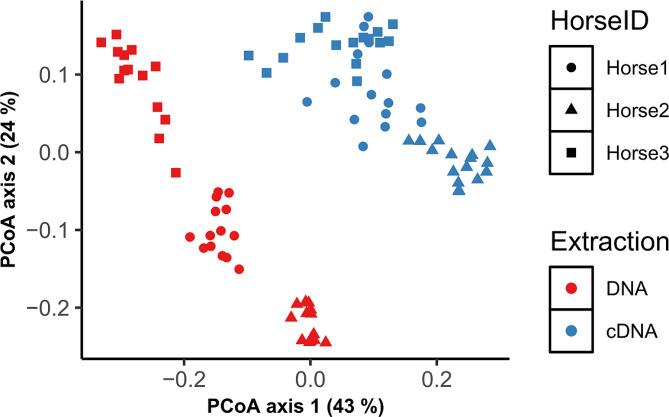
Fig. 2.
Measurement of bacterial community composition (beta diversity) for analysis type (DNA vs. cDNA) and horse. The principal coordinate analysis (PCoA) plot shows weighted UniFrac distances between samples, with samples that are more similar located closer to one another. Each data point represents an individual slurry sample. Differences in beta diversity were seen between extraction type and individual horses, as observed by the clustering of each horse within extraction type, with more variation within each horse for DNA-based analysis than cDNA-based analysis

