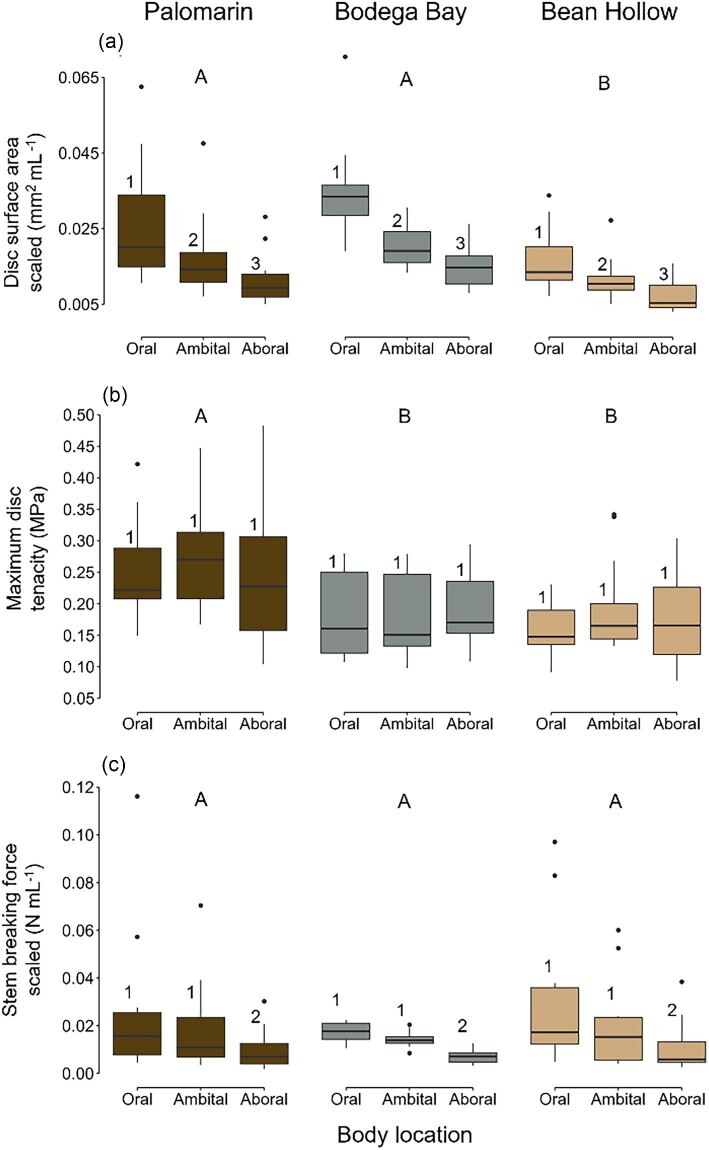
Fig. 1.
Tube foot disc surface area scaled by sea urchin volume (a; mm2 mL−1), maximum disc tenacity (b; MPa), and stem breaking force scaled by sea urchin volume (c; N mL−1), obtained from sea urchins collected from the three populations (n = 11–12 per population) that are color coded: Palomarin Beach (dark brown—mudstone native substrate), Bodega Bay (gray—native granite substrate), and Bean Hollow Beach (tan—native sandstone substrate). Disc surface area, maximum disc tenacity, and stem breaking force were measured on three body locations per sea urchin: oral (bottom section, facing the substrate), ambital (middle section), and aboral (top section, facing the water). The boxplot horizontal line is the median, and box edges are the 25th and 75th percentiles; whiskers indicate the largest value within 1.5 the interquartile distance (IQR) and points beyond are values greater than 1.5 the IQR but less than three times the IQR. Results from mixed linear models on disc surface area, maximum disc tenacity, and stem breaking force showed no significant interaction between population and body location, so Tukey post hoc analyses were conducted independently for population (shown as capital letters) and body locations (shown as numbers).

