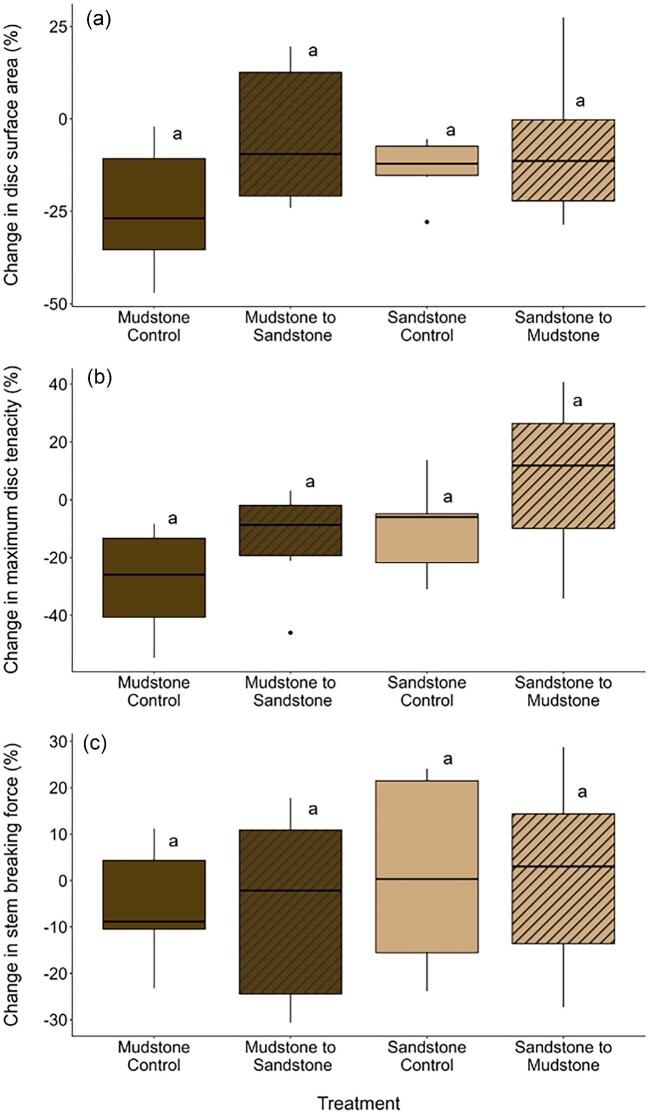
Fig. 2.
Percent change in tube foot disc surface area (a), maximum disc tenacity (b), and stem breaking force (c) of the laboratory-based reciprocal transplant experiment. Percent change was calculated as  , where I represents the initial measurements obtained shortly after field collection (Day 0 or Day 14 in stem breaking force data) and F represents the final measurements at the end of the reciprocal transplant experiment (Day 109). The four treatments of the experiments were: Bean Hollow Beach urchins placed on their native substrate, sandstone (“sandstone control”—tan), Bean Hollow Beach urchins placed on mudstone substrate (“sandstone to mudstone”—tan striped), Palomarin Beach urchins placed on their native substrate mudstone (“mudstone control”—dark brown), and Palomarin Beach urchins placed on sandstone substrate (“mudstone to sandstone”—dark brown striped) (n = 6 per treatment). The boxplot horizontal line is the median, and box edges are the 25th and 75th percentiles; whiskers indicate the largest value within 1.5 the interquartile distance (IQR) and points beyond are values greater than 1.5 the IQR but less than three times the IQR. Substrate treatment had no effect on the response variables, so all treatments share the same letter.

