Fig. 1.
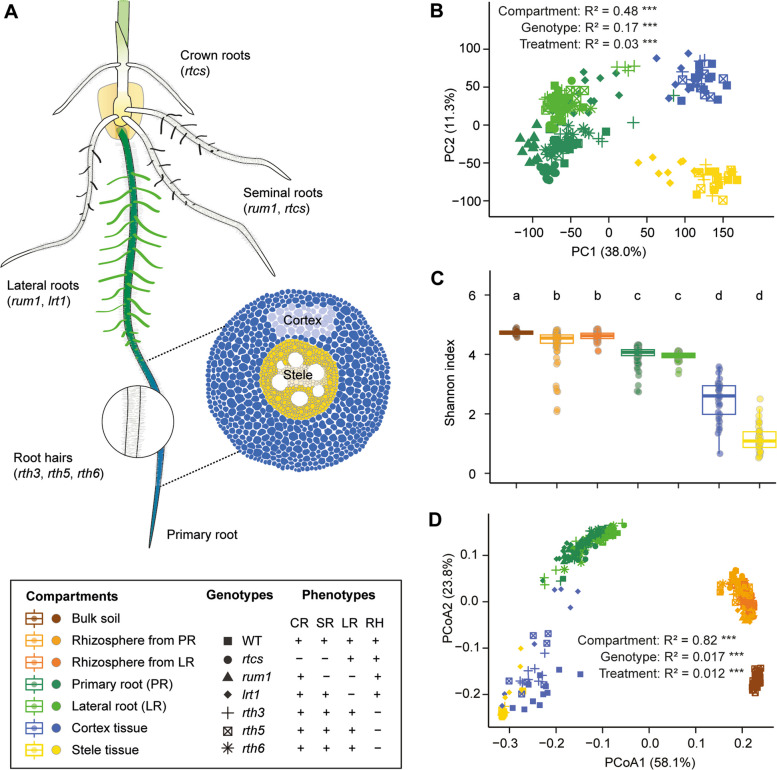
Overall gene expression pattern and bacterial diversity across spatial compartments. A Schematic illustration of maize seedling root system consisting of different root types and tissue (stele and cortex) patterning along the primary root. The cloned genes with known functions affecting root phenotypes are highlighted in brackets. The meristematic and elongation zones were removed during the sampling. The differentiation zone with root hairs and lateral root primordia was physically peeled off to separate the stele and cortex tissue. The differentiation zone with emerged lateral roots was dissected and separated as the lateral roots and primary root without lateral roots. rum1, rootless with undetectable meristem 1; rtcs, rootless concerning crown and seminal roots; lrt1, lateral rootless 1; rth, roothairless. B Principal component analysis (PCA) illustrating the transcriptomic shift across different root compartments along the primary root. C Spatial shift of bacterial α-diversity (Shannon’s diversity index) across the rhizosphere and root compartments along the primary root. Significances were indicated among different compartments by different letters (Benjamini-Hochberg adjusted P < 0.05, Kruskal-Wallis test, Dunn’s post-hoc test). Boxes span from the first to the third quartiles, center lines represent median values and whiskers show data lying within the 1.5 × interquartile range of lower and upper quartiles. Data points at the ends of whiskers represent outliers. D Principal coordinate analysis (PCoA) showing the dissimilarity of bacterial β-diversity across the rhizosphere and root compartments. For both bacterial and transcriptomic dissimilarity matrix data, the explained variance by compartments, genotype, and nutrient treatment conditions was assessed by permutational analysis of variance (PERMANOVA, P < 0.001). We did not label different nutrient symbols due to the relatively small effect in comparison to the compartment and genotype. The sample sizes are indicated below: bulk soil (n = 42); rhizosphere from primary root (PR) (n = 78); rhizosphere from lateral root (LR) (n = 57); primary root (n = 84); lateral root (n = 60); cortex tissue (n = 33); stele tissue (n = 34)

