
Figure 2.
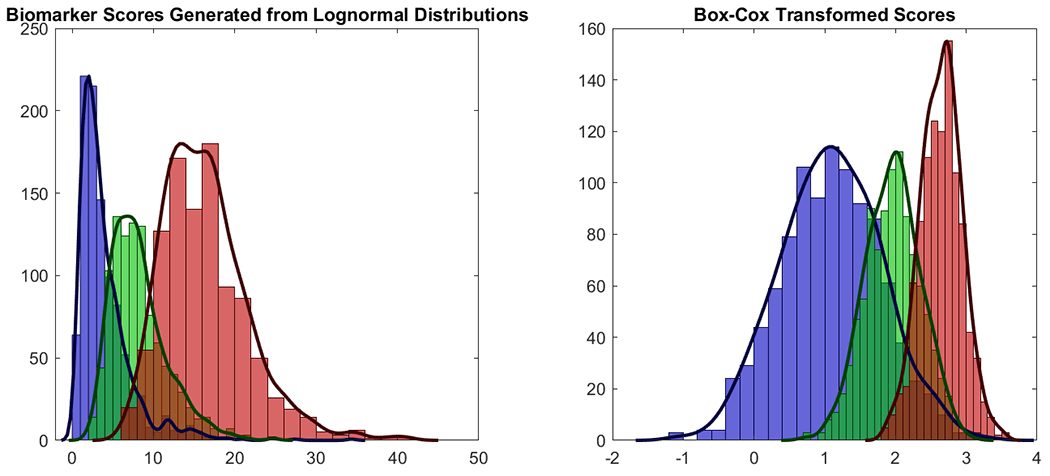
The plot demonstrates the use of the Box-Cox transformation in the context of ROC analysis. A single biomarker with 3 groups uses a single value of λ to transform all 3 groups to normality. When using this approach to combine p biomarkers, we obtain p separate λ’s to transform each biomarker to normality.