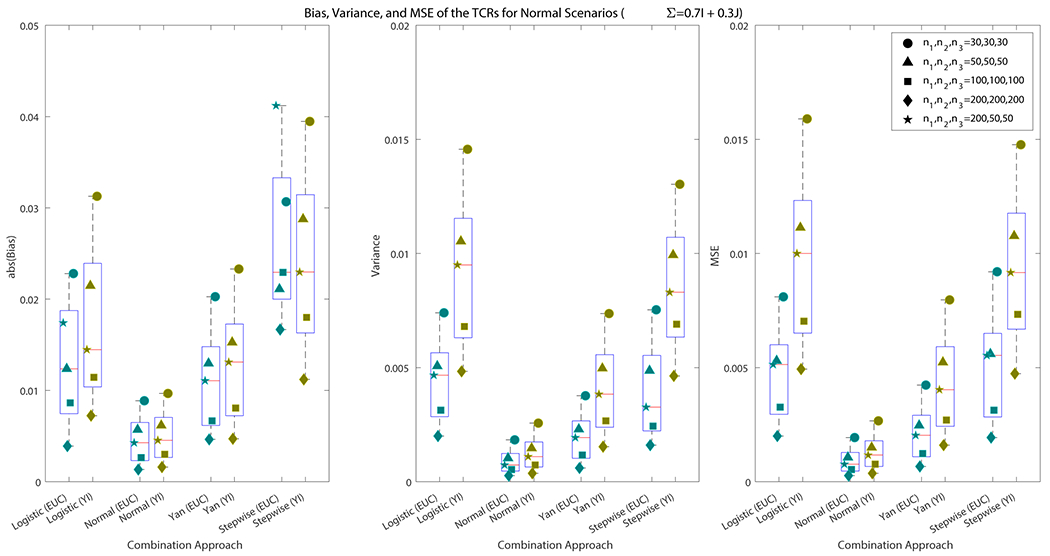
Figure 4.

The first panel in the figure displays the average of , and for each of the explored sample sizes. The second panel displays the average of , and for each scenario. The third panel displays the average of , and for each scenario. We see that for most scenarios, the Euclidean method had smaller bias than the Youden index. For all scenarios, the Euclidean method had smaller variance and MSE.
