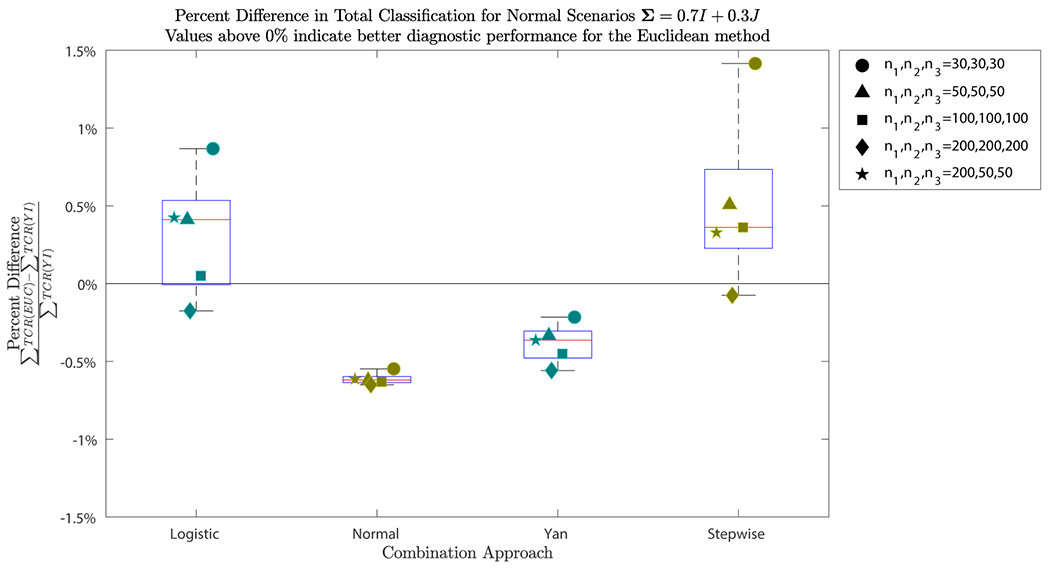
Figure 5.

The plot displays the percent difference in , i.e. total classification, for the Euclidean method (EUC) versus the Youden index (YI) for each of the combination approaches and sample sizes, where . The percent difference is calculated by . Values above correspond to a higher total classification for the Euclidean method than the Youden index, indicating better diagnostic performance for the Euclidean method. Both logistic regression and the stepwise procedure saw higher total classification than the Youden index for all sample sizes except when . For the normality assumption and Yan’s method, the Youden index saw higher total classification that was less than higher than that of the Euclidean method.
